Skewness
Skewness is a measure of the asymmetry of a probability distribution around its mean. The skewness value can be positive, negative, zero, or undefined.
- Negative Skew: The tail of the distribution is on the left side.
- Positive Skew: The tail of the distribution is on the right side.
- Zero Skew: The distribution is symmetrical.
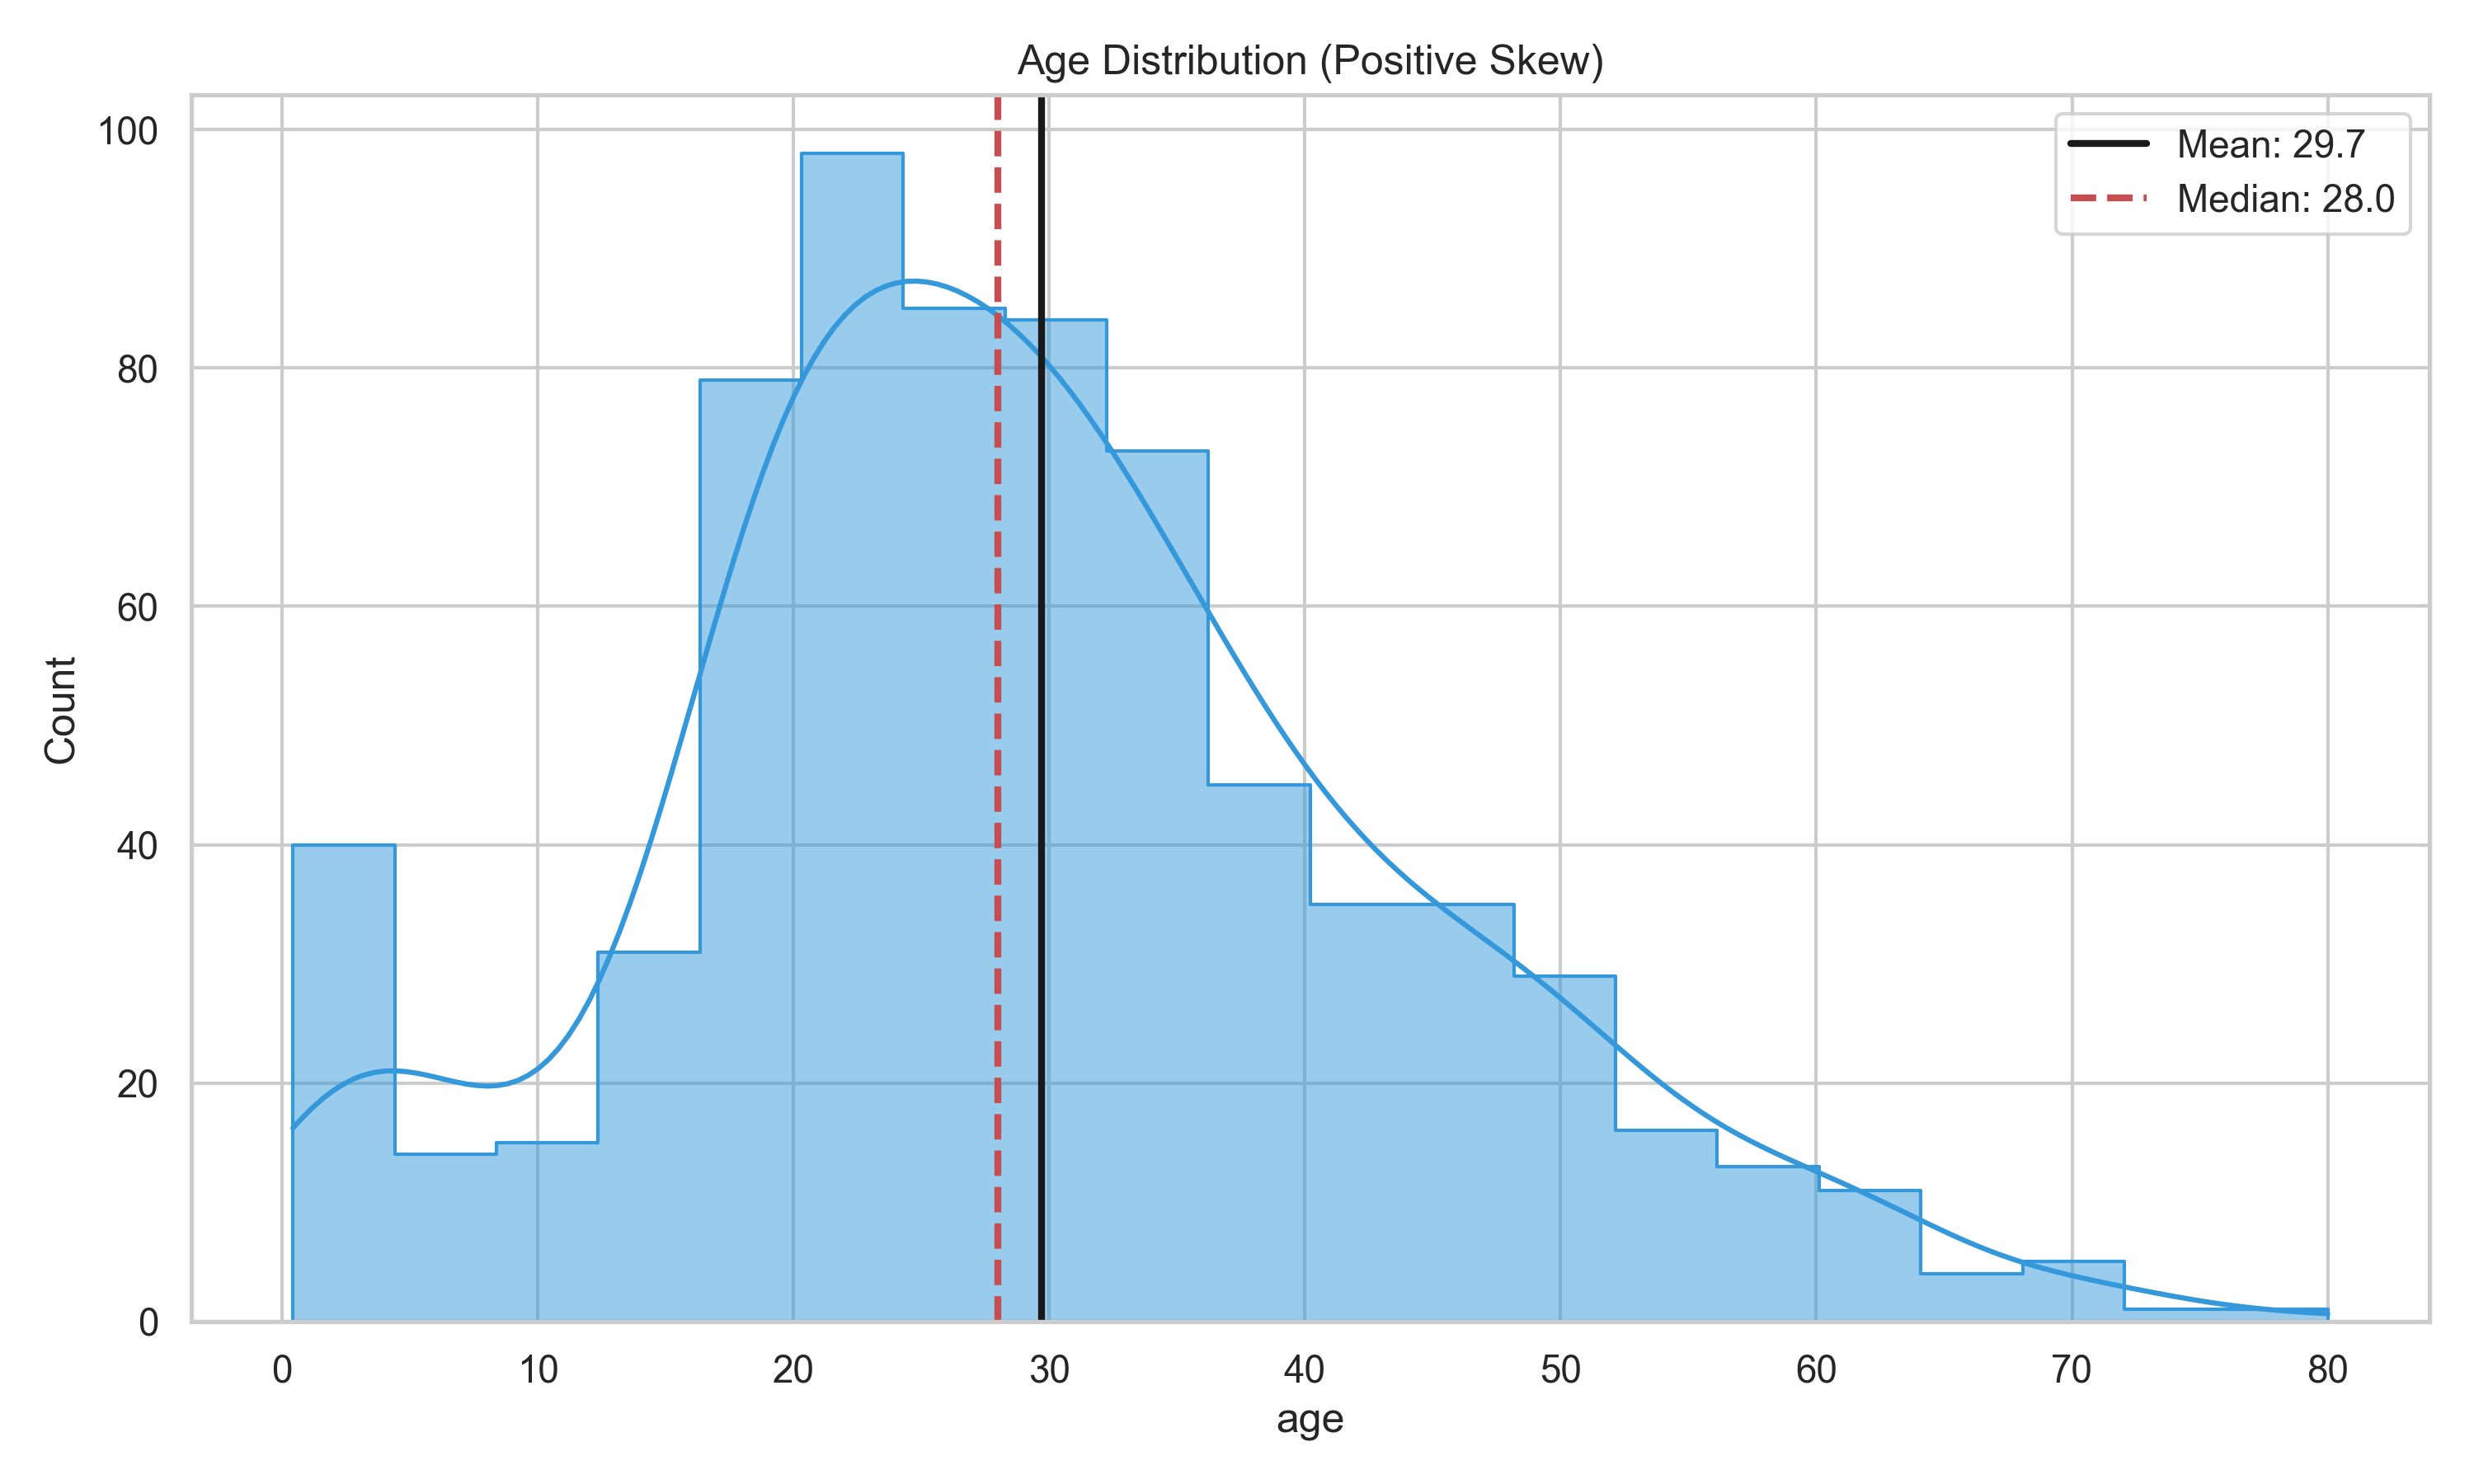
In the Titanic dataset, the age distribution has a positive skew, as the tail is on the right. This indicates that there are more younger passengers and a smaller number of older passengers.
The following code generates a histogram of the age distribution from the Titanic dataset, showing the mean and median:
import matplotlib.pyplot as plt
# Assuming 'df' is a pandas DataFrame containing the Titanic data
age = df['age'].dropna()
ax = age.plot(kind='hist', histtype='step', title='Example of Positive Skew - Tail is on the right')
plt.axvline(age.mean(), color='k', linestyle='solid', linewidth=2, label="mean")
plt.axvline(age.median(), color='r', linestyle='dashed', linewidth=2, label="median")

labels = ["mean", "median"]
handles, _ = ax.get_legend_handles_labels()

# Slice list to remove last handle
plt.legend(handles = handles[:-1], labels = labels)
A zero skew value indicates that the tails on both sides of the mean balance out. This typically happens when the mean, median, and mode have the same value.
In a positively skewed distribution, the mean is typically to the right of the median. This is because the mean is influenced by the long tail of higher values (outliers), pulling it in that direction.