Central Tendencies
The most common summary statistics for a numerical variable are the mean, median, and mode. These are known as measures of central tendency and are the starting point for most data analysis.
Typical examples where these are used include calculating the average marks of students in a class or the average height and weight of newborn children. Measures of central tendency represent the central or typical value of a distribution.
Exercise
Here is a link to a dataset containing information about the passengers who boarded the Titanic. Download the data and open the file using a tool like JupyterLab.
If you have not yet installed Anaconda or JupyterLab, you can find instructions here.
Once you open the file, examine the various columns. For this exercise, we will focus on the "age" column.
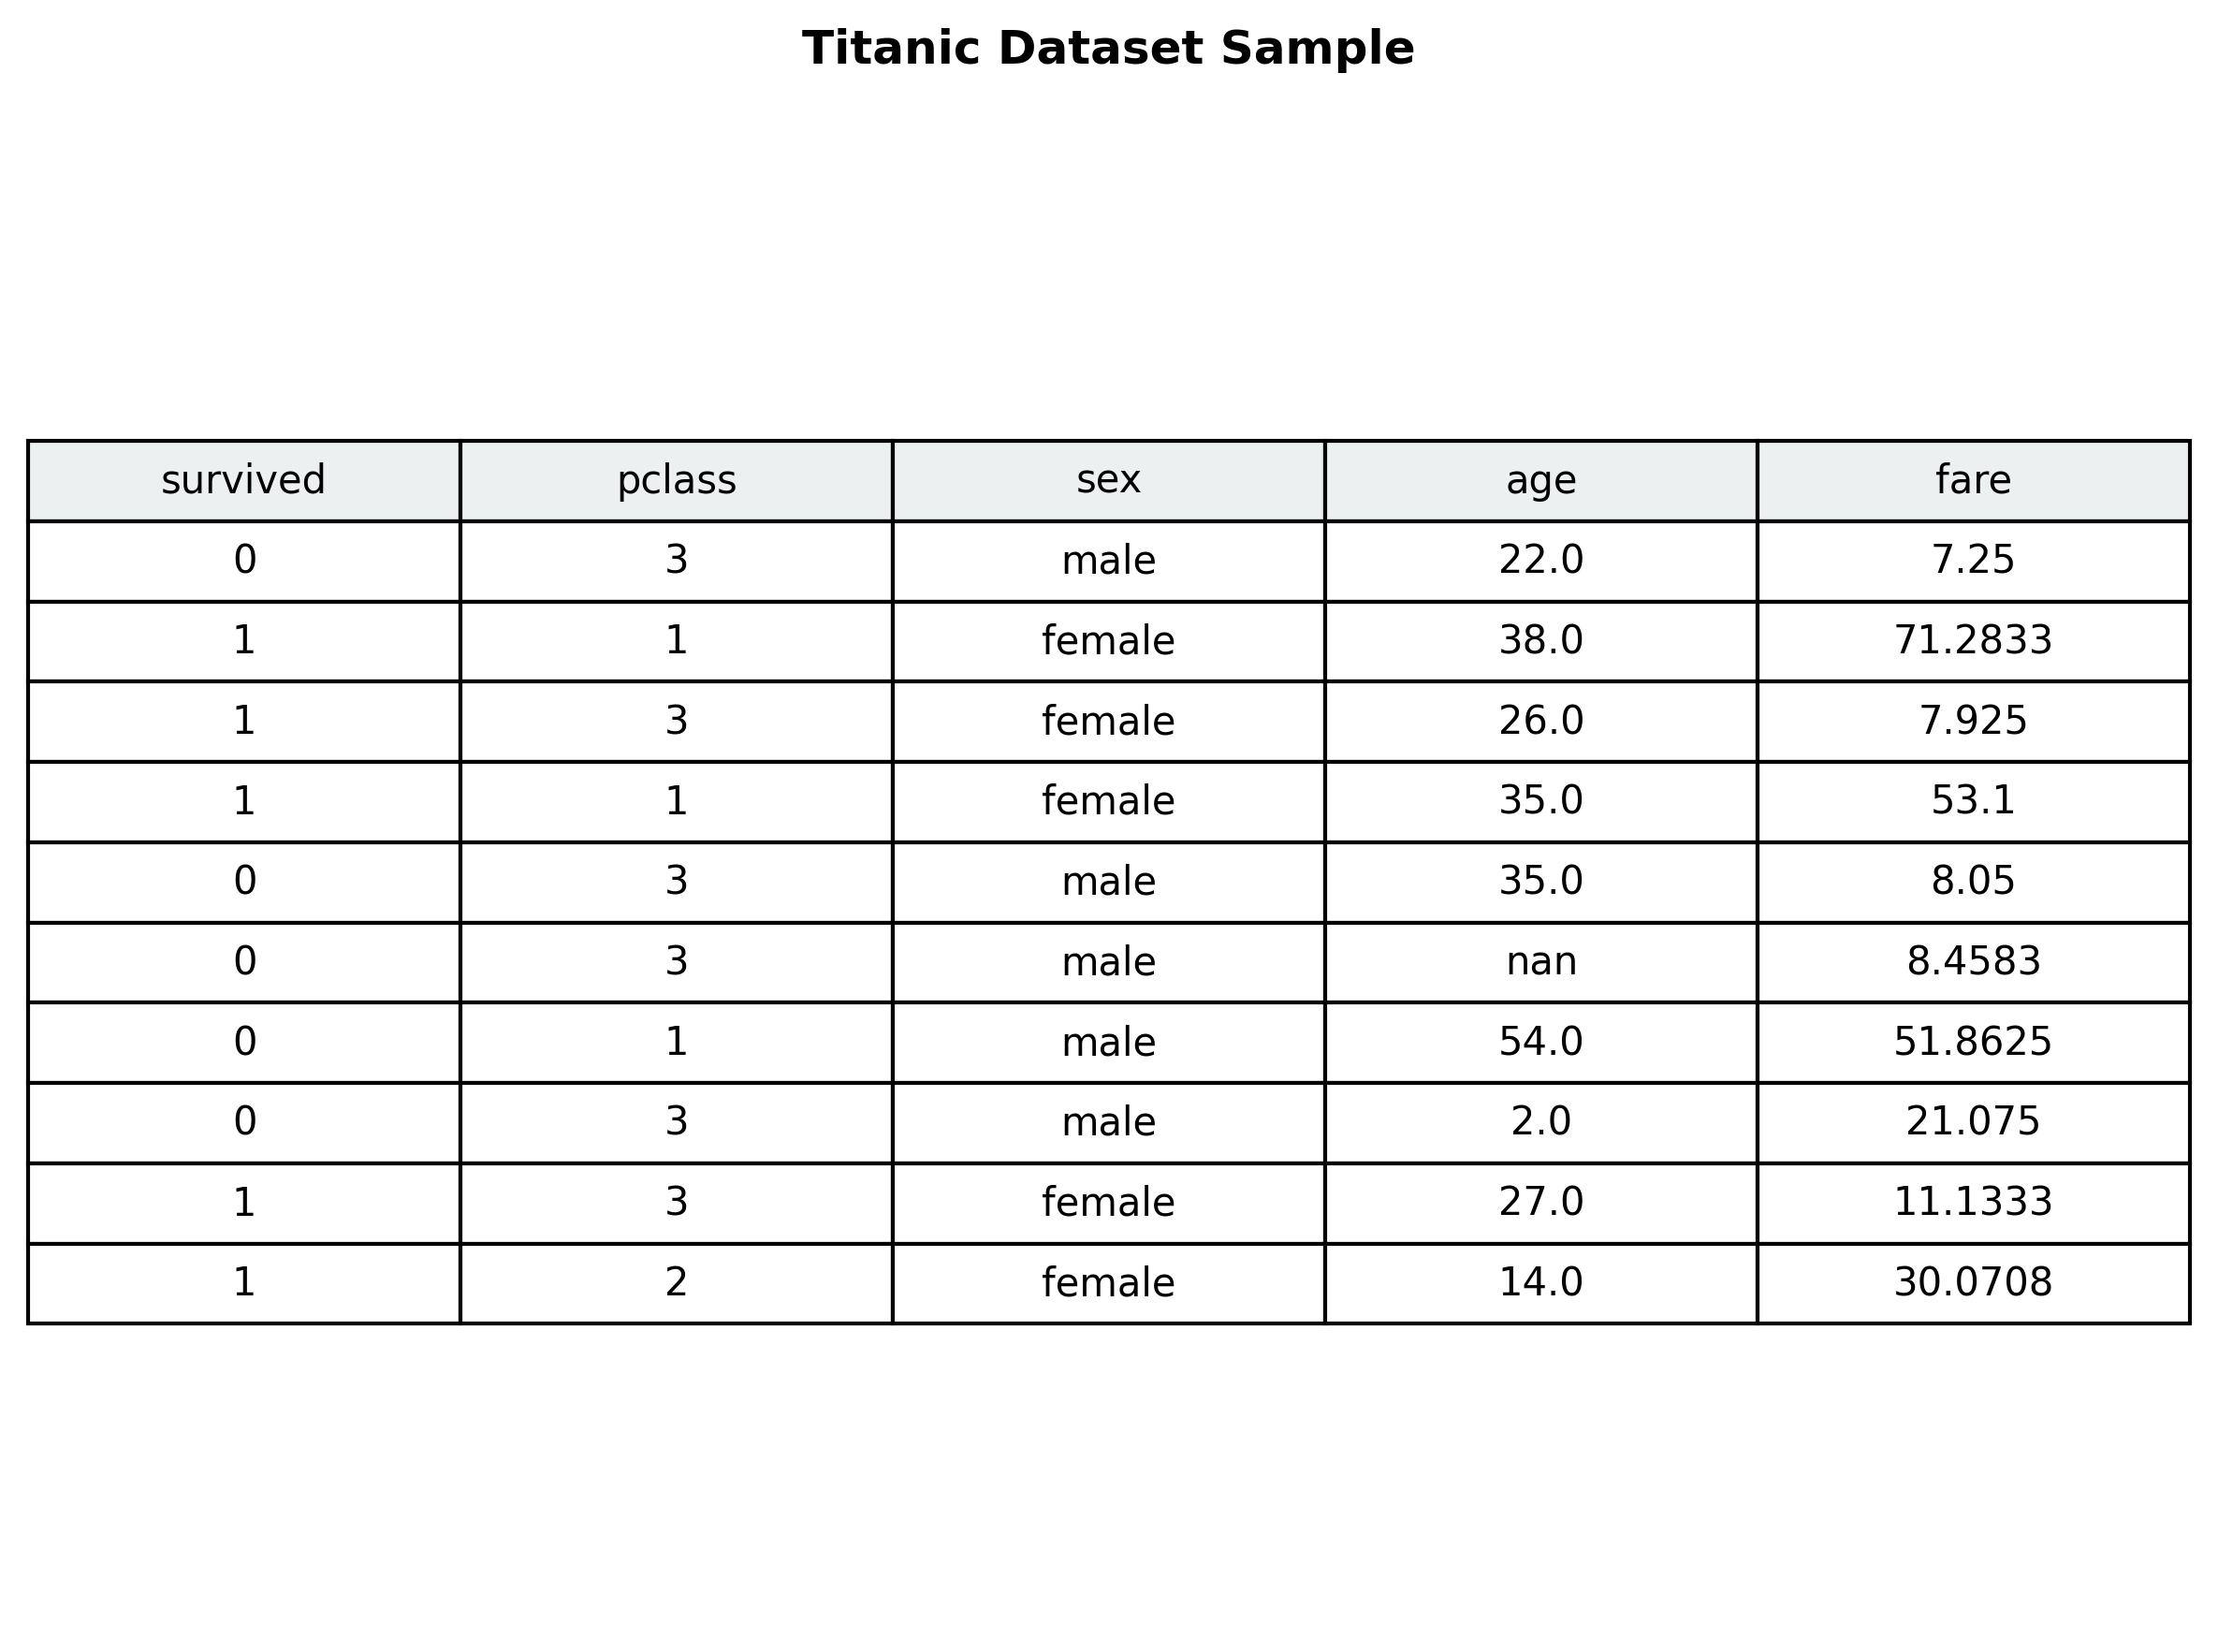
We will use a sample of the first 20 records to calculate our statistics. Note that the 6th, 17th, and 19th records have no age information. We will skip those records for now and analyze the remaining 17 values:
age = 22, 38, 26, 35, 35, 54, 2, 27, 14, 4, 58, 20, 39, 14, 55, 2, 31
Mean
The mean of a set of numbers is the sum of the numbers divided by the count of the numbers. To find the mean age of the passengers in our sample, you would write the following code:
Output: mean = 28
The mean age of the passengers in this sample is 28. With this, we have uncovered our first metric!
There are other types of means used in different scenarios:
- Weighted mean: Certain values are given more weight when calculating the mean.
- Trimmed mean: A small percentage of the largest and smallest values (outliers) are removed before calculating the mean.
- Geometric mean: The nth root of the product of all the values. This is often used in finance to calculate the average annual return over a period of time.
Median
The median of a set of numbers is the value that lies at the midpoint of the distribution, with an equal number of values above and below it. If the set has an odd number of values, the median is the middle number. If the set has an even number of values, the median is the mean of the two middle numbers. To find the median, you must first sort the values.
[2, 2, 4, 14, 14, 20, 22, 26, 27, 31, 35, 35, 38, 39, 54, 55, 58]
Since we have an odd number of values (17), the median is the middle value of the sorted list. From the output above, you can see that 27 is the middle value, with 8 numbers before it and 8 numbers after it.
Here is a generic program that works for both odd and even numbers of values:
Output: 27
The median age of the passengers is 27. We've found another important metric!
In this sample, the mean and median are very close. But what does it mean if they are vastly different?
Mean or Median?
In the Titanic example, the "age" column does not have extreme outliers. An outlier is a data value that deviates markedly from other values in the sample.
Let's consider a different example: a sample of salaries in a city.
salaries = [35k, 45k, 40k, 38k, 48k, 32k, 1 million]
- Mean: 143,095
- Median: 40,000
In this sample, almost all salaries are below 50k, except for one outlier of 1 million. If you were asked to give the typical salary in this city, would you choose the mean or the median?
If you answered median, you are correct! The median better represents the typical salary in this city. The outlier of 1 million skews the mean, making it a poor representation of the central tendency.
While the median is immune to outliers, the mean is susceptible to them. This is why you often see median values reported in salary surveys.
Note: For this exercise, we used a small sample of 20 records to keep the explanation simple. In a real-world scenario, you would run your analysis on the entire dataset.