Sampling
To perform statistical calculations, we need data. In statistics, we typically don't study an entire population; instead, we collect a smaller sample. For our findings to be meaningful, the sample must accurately represent the population.
In the ZingM pill experiment, the 10 participants constituted the sample drawn from a larger population.
A critical factor in sampling is randomness. A truly random sample closely represents the population, and the statistics derived from it will closely reflect the population's parameters.
Let's clarify these terms:
- Population: The entire group of individuals that the study is about. A population isn't necessarily all people on Earth; it's the complete set of participants relevant to the research question. For example, if you are surveying students' satisfaction with their school's administration, the entire student body of that school is your population.
- Parameter: A characteristic of the population. For example, the average age of all students in the school is 29.
- Statistic: A characteristic of the sample. For example, the average age of 45 randomly sampled students is 28.
Here are some common sampling techniques:
Simple Random Sample (SRS): The most basic method, where every member of the population has an equal chance of being selected.
Stratified Random Sample: The goal of stratified sampling is to ensure that various subgroups of a population are adequately represented in the sample.
- Process: First, you divide the entire population into distinct, non-overlapping subgroups (called "strata") based on a shared characteristic (e.g., age, gender, school grade). The members within each stratum should be similar (homogeneous). Then, you perform a Simple Random Sample from each stratum.
- Example: To survey a high school's student body about a new policy, you would first divide the students into four strata: Freshmen, Sophomores, Juniors, and Seniors. Then, you would randomly select 25 students from each of those four groups. This ensures the opinions of each grade level are included.
- Use When: You need to guarantee representation from specific subgroups. It is more precise but often requires more effort.
Cluster Sample: The goal of cluster sampling is to make sampling more efficient, especially when a population is geographically dispersed.
- Process: First, you divide the population into clusters (e.g., cities, schools, neighborhoods). Each cluster should ideally be a mini-representation of the population (heterogeneous). Then, you randomly select a number of entire clusters and include all individuals from the selected clusters in your sample.
- Example: To survey the same high school, you could treat each homeroom class as a cluster. You would then randomly select, for instance, 5 homerooms. You would then survey every single student within those 5 selected homerooms. You don't sample from the clusters; you take the whole cluster.
- Use When: The population is naturally grouped, and it's impractical to sample individuals from every group. It is easier to execute but can be less precise than stratified sampling.
However, some studies use non-random sampling methods, which can lead to biased results. Beware of these poor techniques:
- Convenience Samples: The sample is chosen based on ease of access (e.g., "To get a sample for my memory test, I'll just ask students in my class!").
- Voluntary Samples: Participants self-select to join the sample (e.g., any online survey).
The Foundation of Randomness
John Venn described the underlying principle of randomness in The Logic of Chance:
In a shower, no one can guess the whereabouts at any instant a drop will fall, but we know that if we put out a sheet of paper it will gradually become uniformly spotted and if we were to mark out any two uniform areas on the paper, these would gradually be stuck equally often.
This illustrates the foundation for obtaining a random sample from a population.
Handling Imbalanced Data
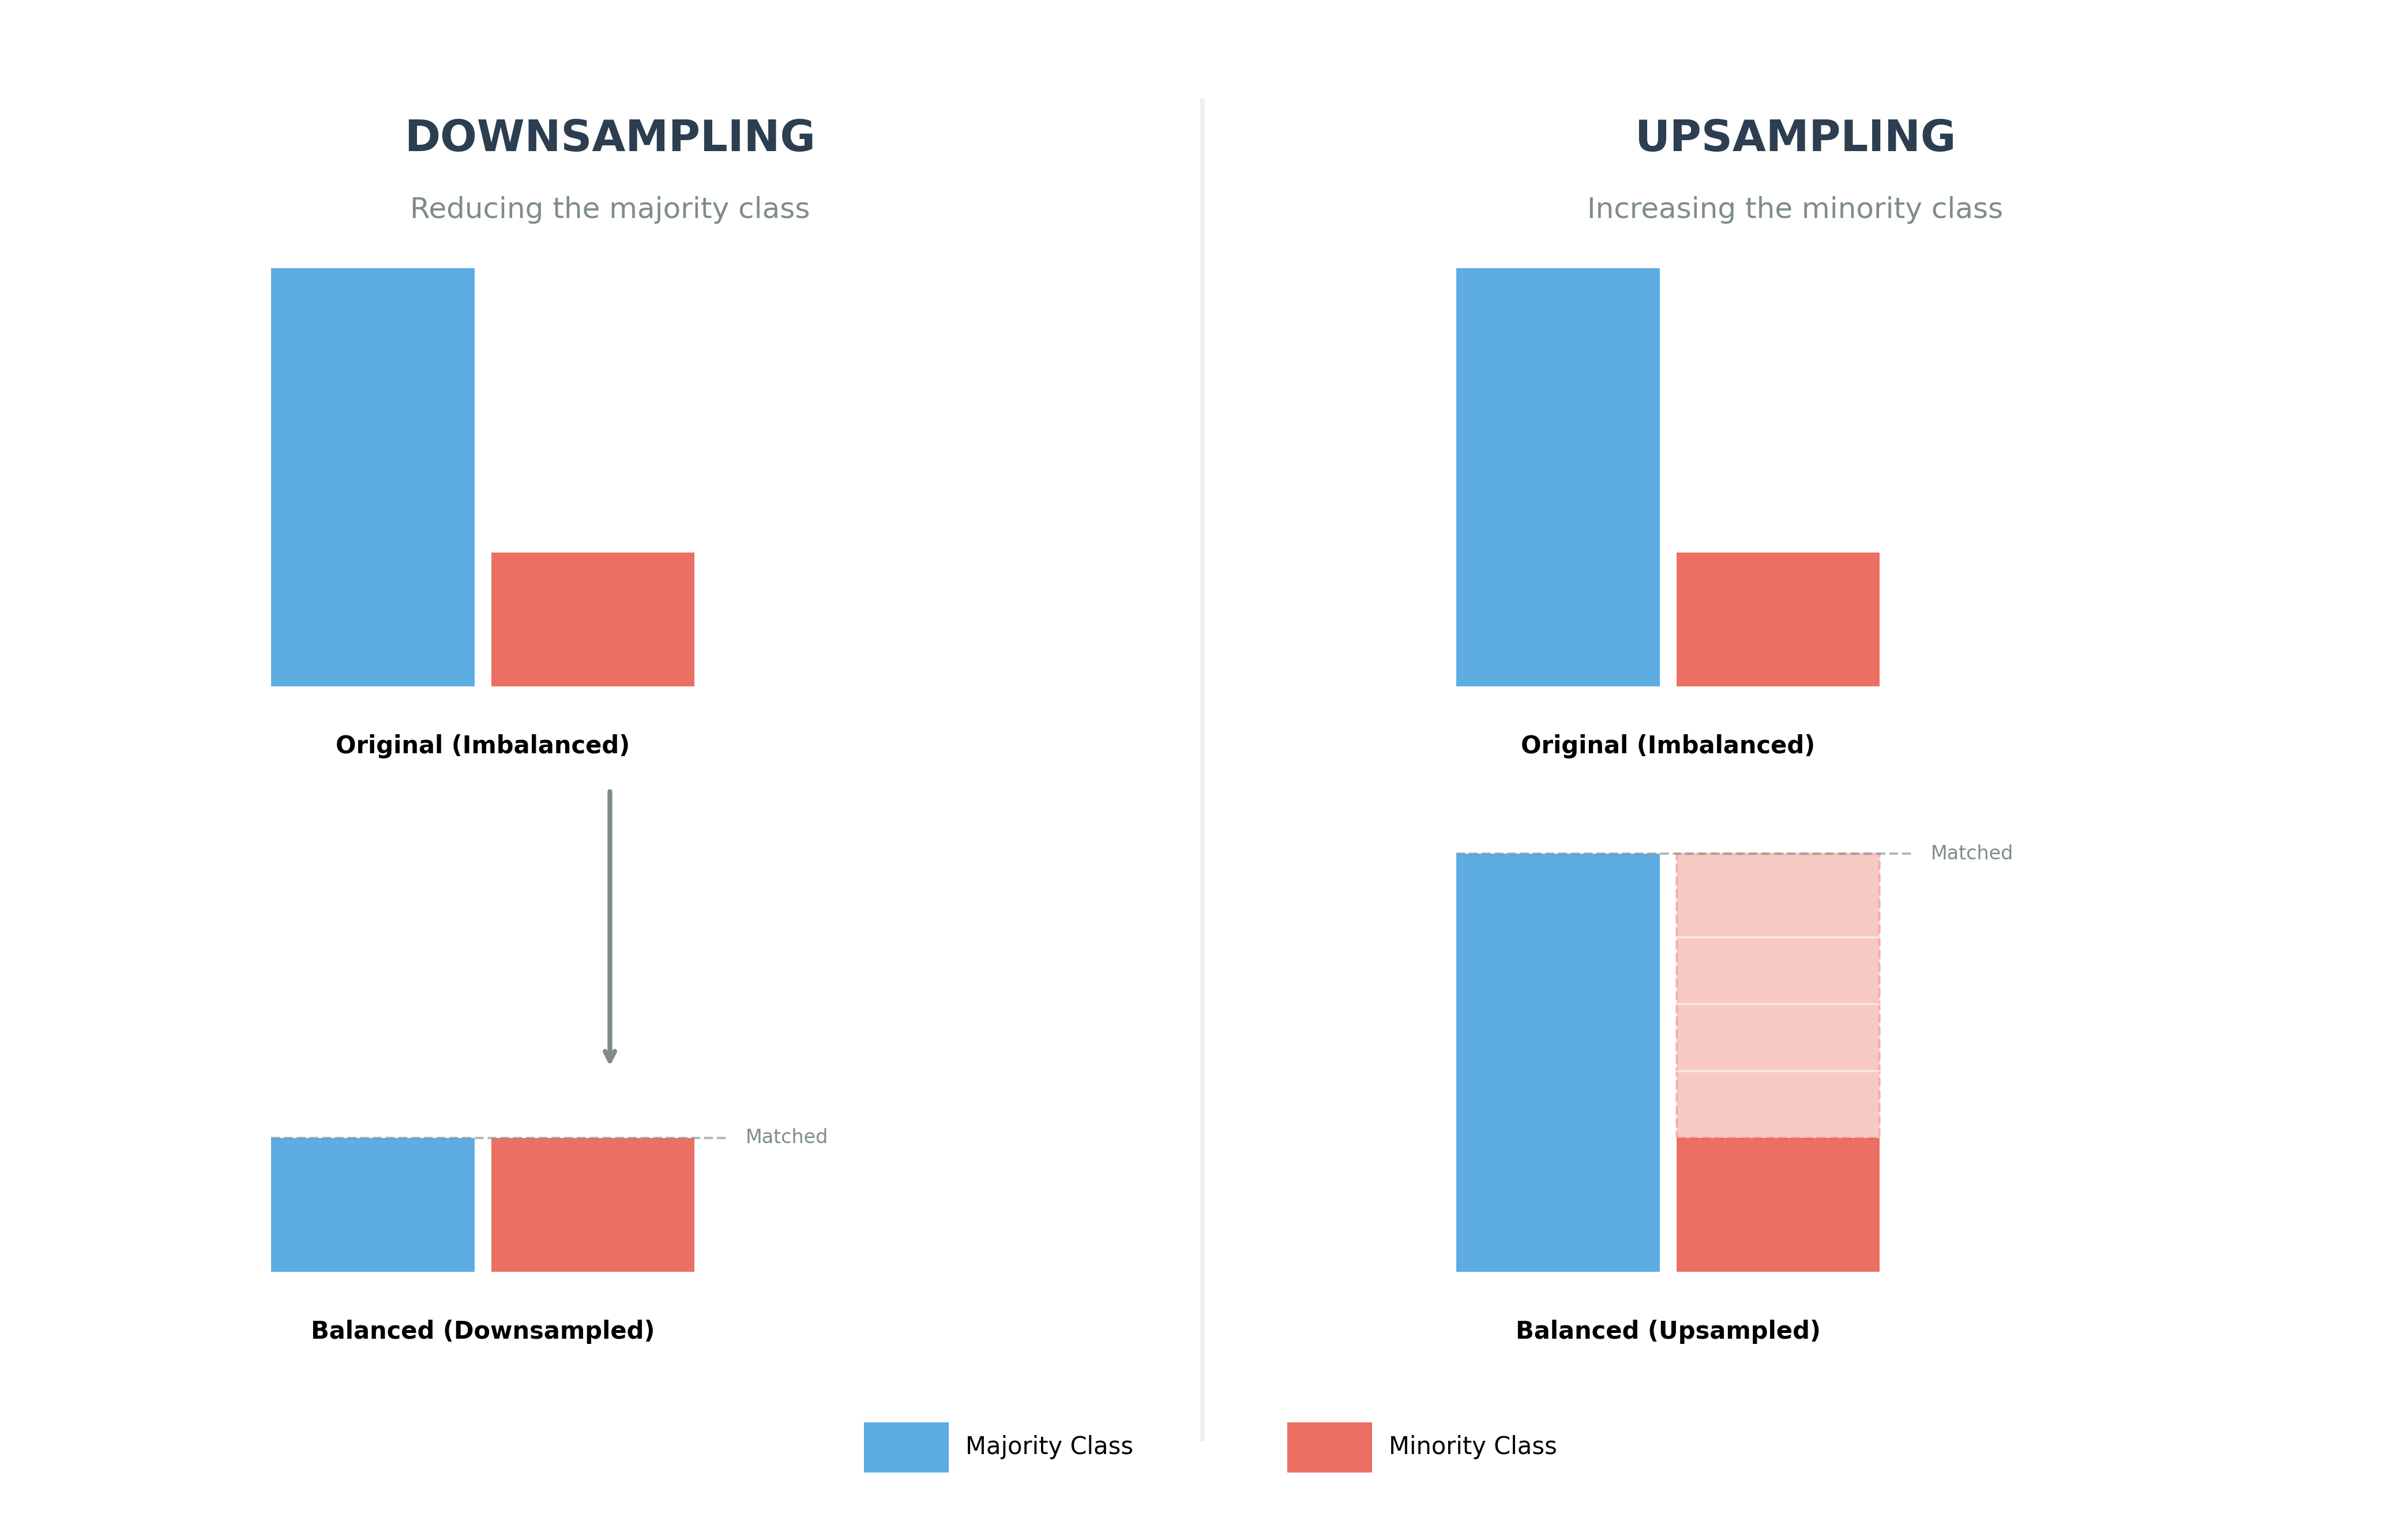
In many real-world scenarios, one class of data might significantly outnumber another (e.g., fraud detection where non-fraudulent transactions are the vast majority). This is known as imbalanced data. To build effective models, we often need to rebalance the dataset using sampling techniques:
- Downsample (Undersampling): Reducing the number of samples from the majority class. We randomly select a subset of the majority class to match the size of the minority class. This is useful when you have a massive amount of data, but it does discard potentially useful information.
- Upsample (Oversampling): Increasing the number of samples in the minority class. This is often done by replicating existing minority samples or generating new synthetic ones until the classes are balanced. This preserves all information but can lead to overfitting if not done carefully.
A Few Other Statistical Terms
- Treatment: In an experiment, a treatment is the specific condition or intervention applied to the subjects. Researchers are interested in how different treatments might yield different results.
- Observational Study: A study where researchers observe subjects and measure variables of interest without assigning treatments to the subjects.