Correlation
Correlation is a statistical measure that expresses the extent to which two variables are linearly related, meaning they change together at a constant rate. It's a way to see if there is a relationship between a pair of variables, assuming all other factors are held constant.
Positive Correlation
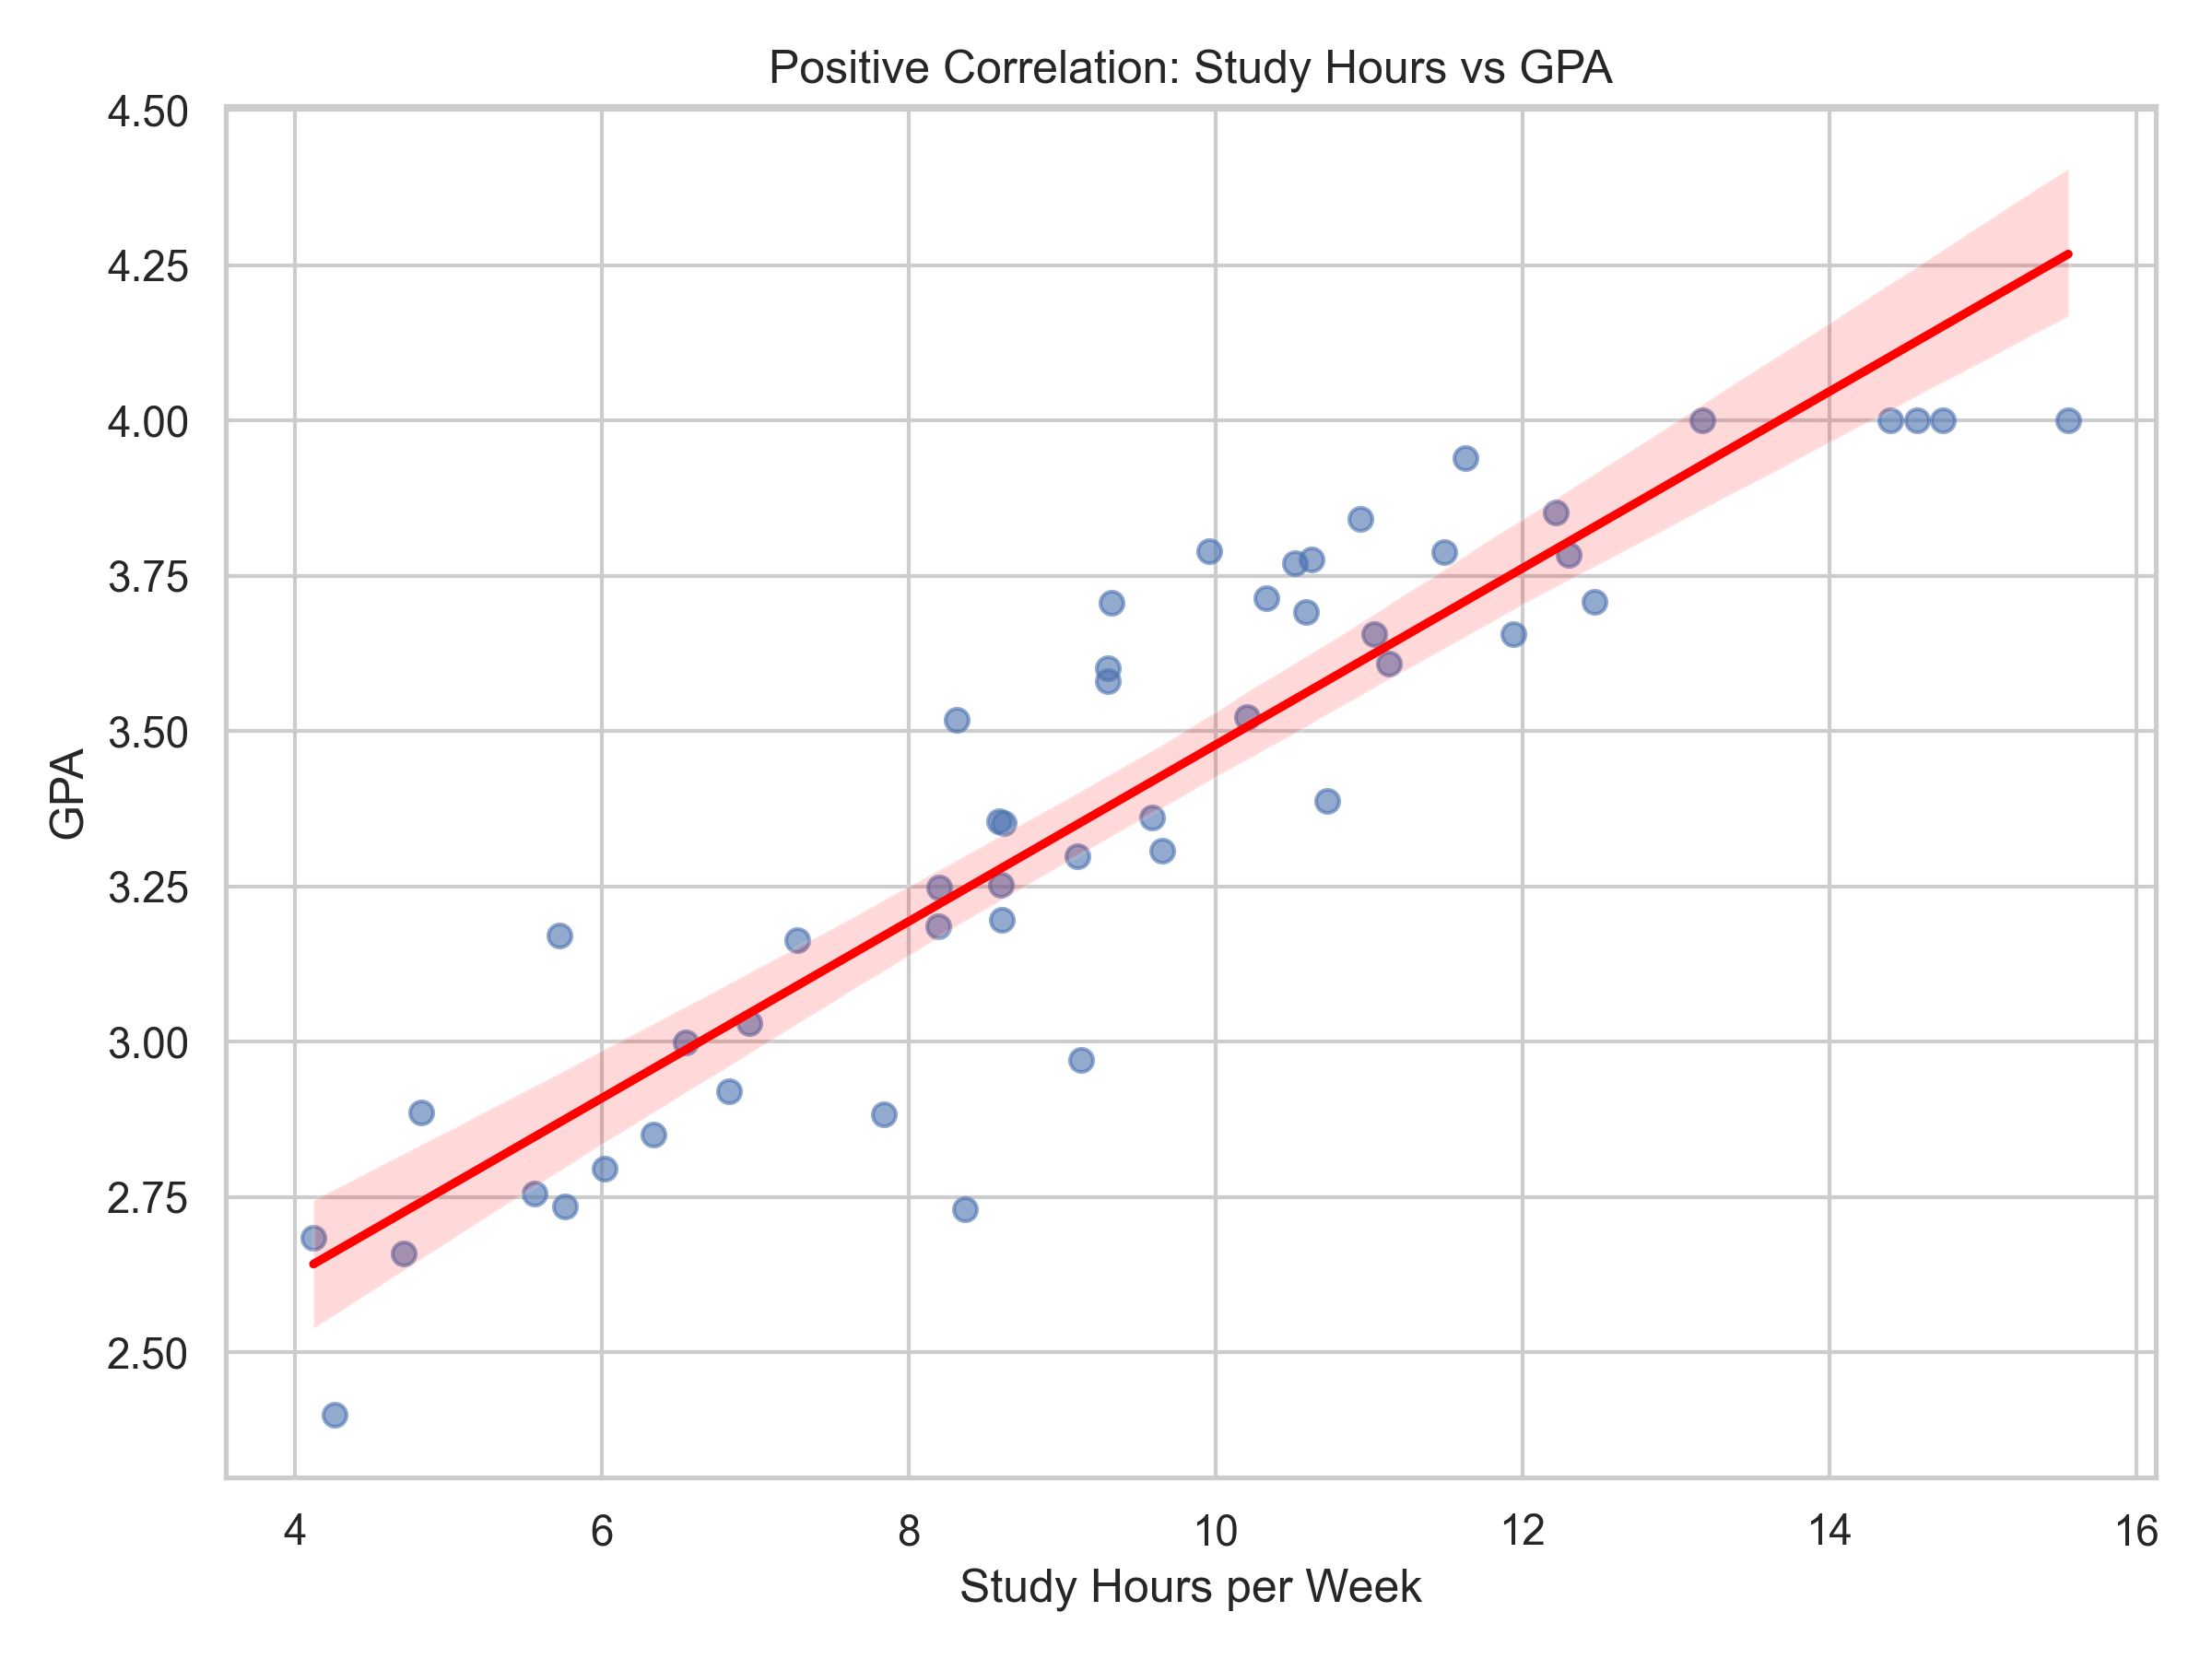
Two variables are positively correlated when an increase in one variable is associated with an increase in the other.
For example, if students study more, their GPA tends to improve. We can say that the amount of time spent studying has a positive correlation with a student's GPA. A scatter plot can visualize this relationship, with "Study Hours per Week" on the x-axis and "GPA" on the y-axis.
Negative Correlation
Two variables are negatively correlated when an increase in one variable is associated with a decrease in the other.
For example, if students skip more classes, their GPA tends to go down. This inverse relationship can also be shown on a scatter plot.
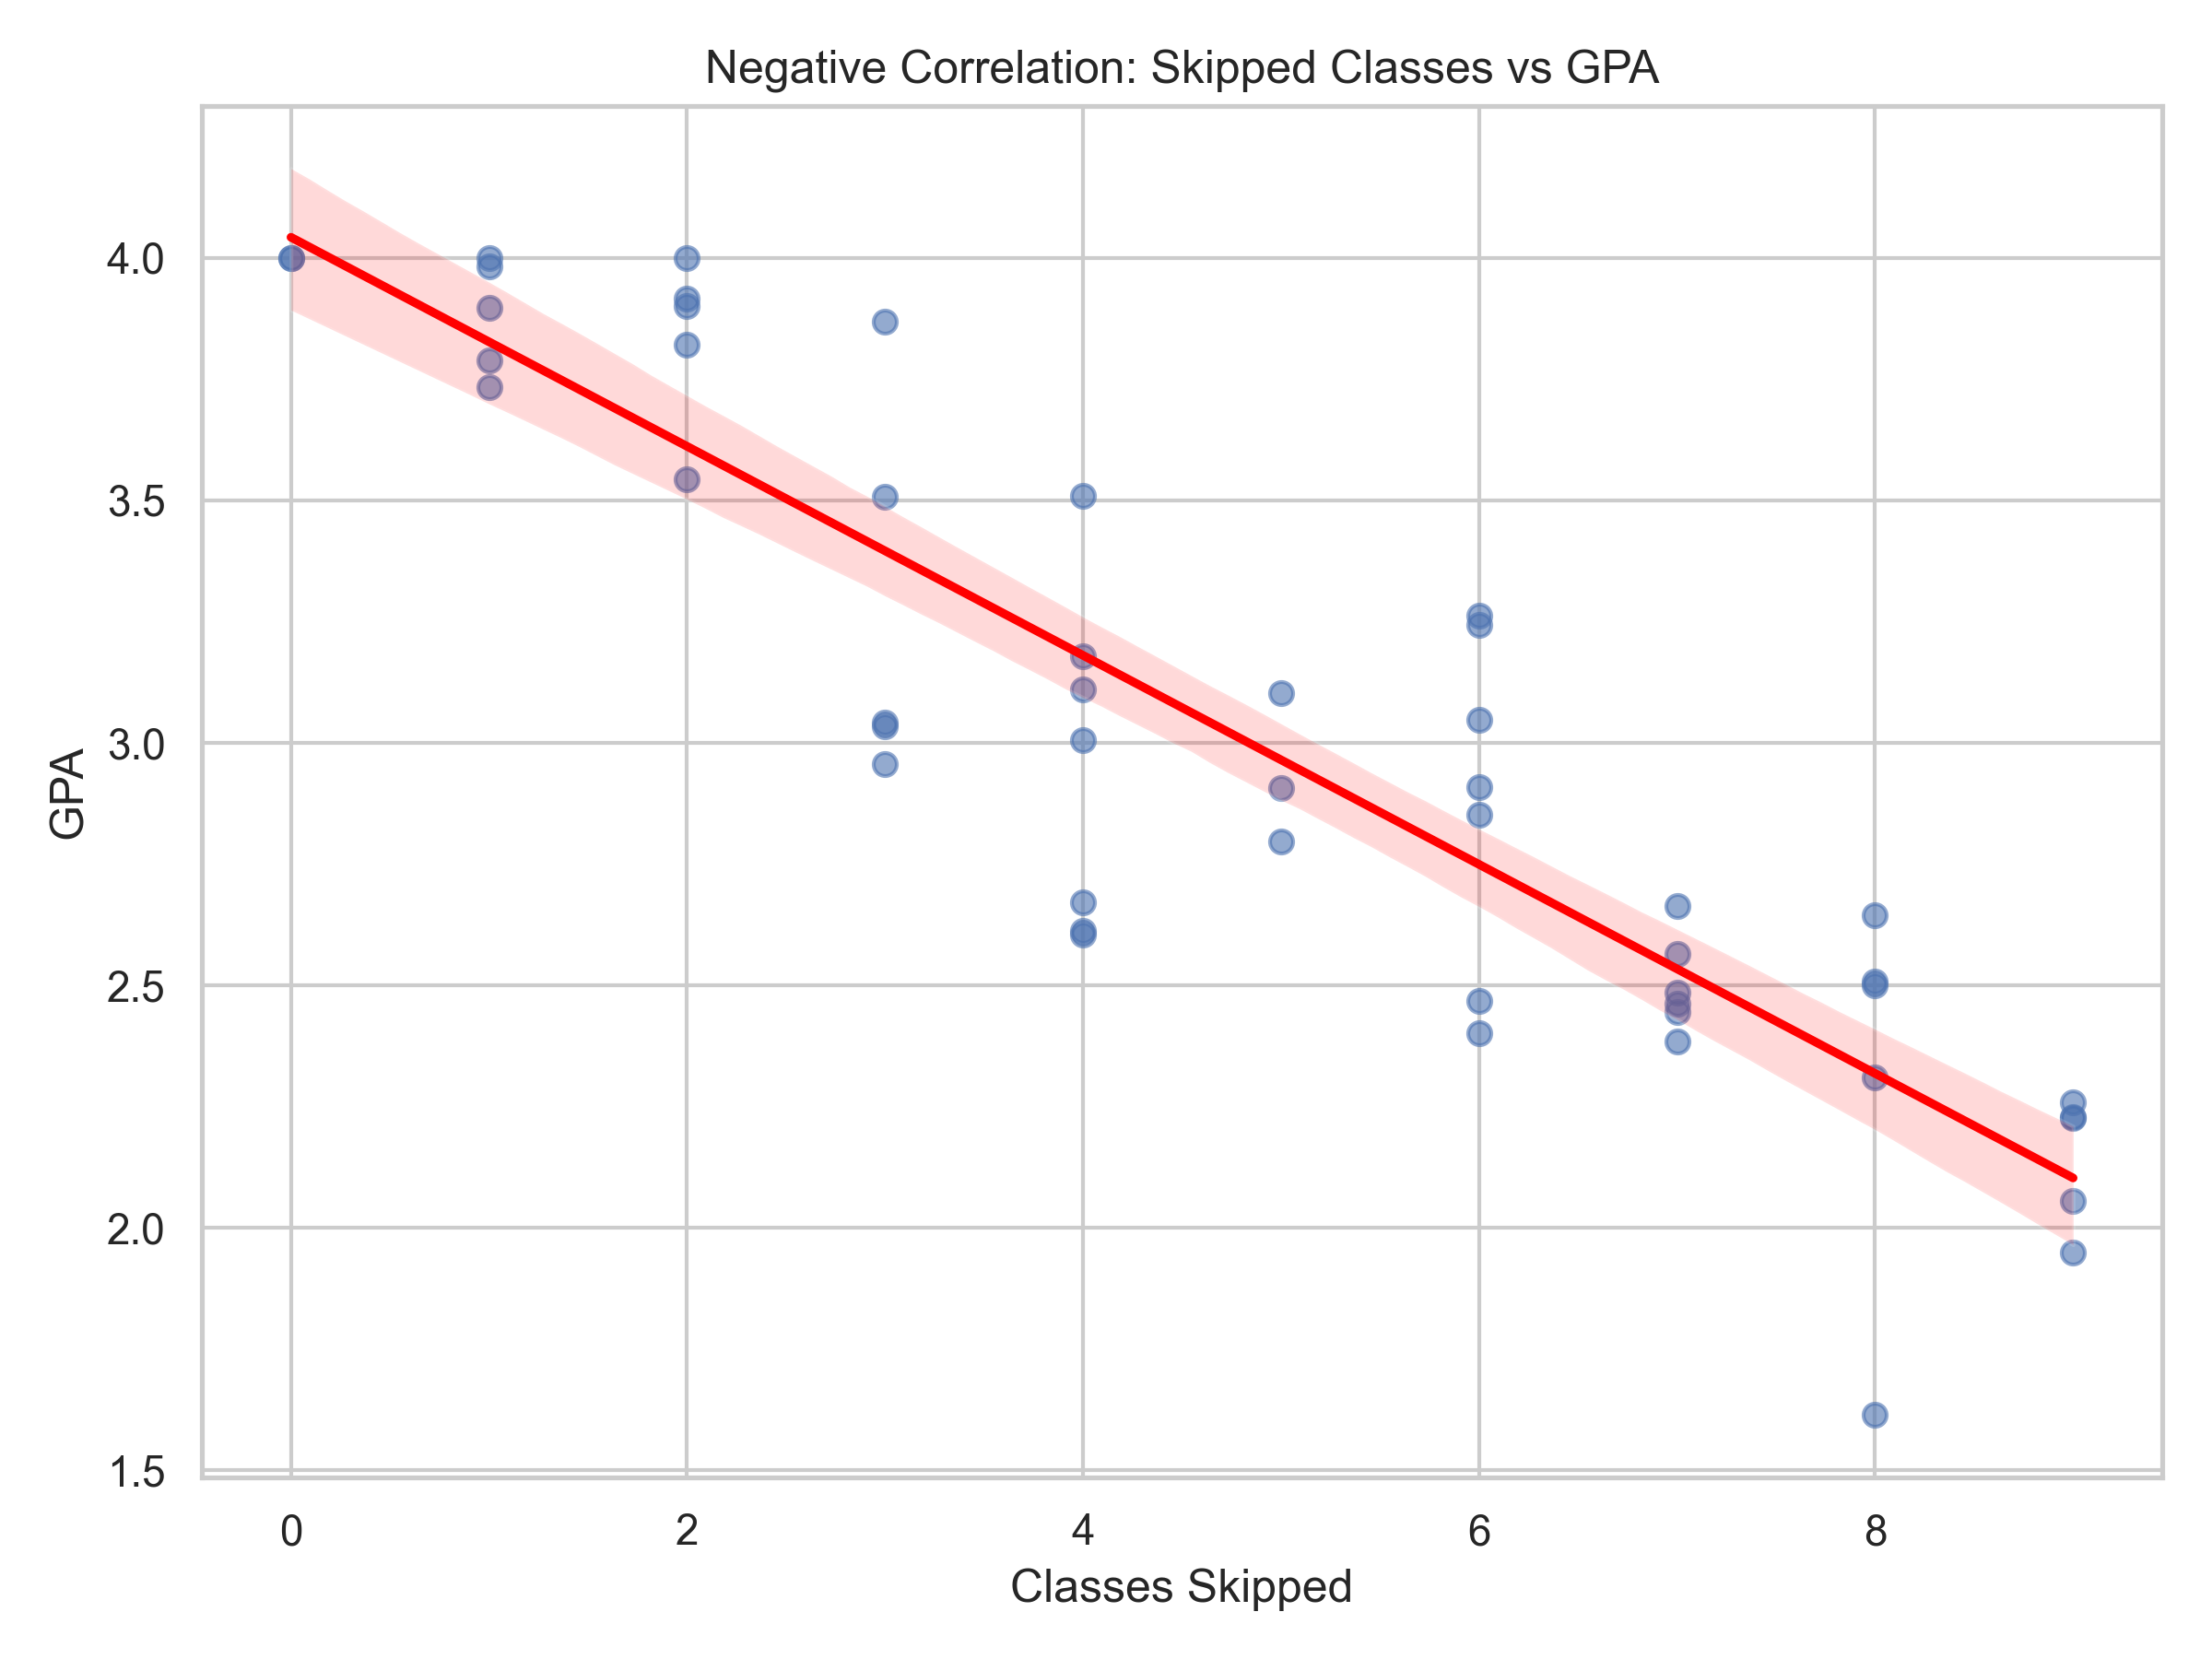
Both plots above show a regression line, which is the best-fitting straight line through the data points that summarizes the relationship between the variables.
Correlation Coefficient
While a scatter plot gives us a visual sense of the relationship, the correlation coefficient (r) gives us a precise numerical measure. It standardizes the measure of association to a range between -1 and +1.
- +1: A perfect positive correlation.
- -1: A perfect negative correlation.
- 0: No correlation.
Values between 0 and +1 indicate a weak to strong positive correlation, while values between 0 and -1 indicate a weak to strong negative correlation. You can learn more about interpreting the correlation coefficient here.
You can interactively plot a best-fitting line here.