Data Collection Basics
A Data Analyst's job revolves around hypotheses and data. Either they have been given a hypothesis and are asked to analyze data to prove or disprove it, or they are asked to formulate a hypothesis and produce descriptive summaries to support it.
So...
What is a Hypothesis?
A hypothesis is a theory or proposed explanation for a phenomenon, made on the basis of limited evidence, that serves as a starting point for further investigation. Formulating a hypothesis is a stepping stone toward drawing factual conclusions.
This also means a hypothesis may be proven wrong when tested against bigger and better data. Nevertheless, as a Data Analyst, you always try to find a theory or hypothesis hidden in the data. If you only have a hypothesis but no data, you must first collect the data to support it. This chapter will introduce the techniques and terminologies used in scientific data collection.
When you need to collect data to support your hypothesis, you first have to figure out how to measure the outcome that corroborates your theory.
Example: The ZingM Memory Pill
Let's take an example to make this clear. Hypothetically, let's assume a company called ZingM produces a pill to improve human memory. ZingM has tasked a new researcher with collecting data that corroborates the company's hypothesis. The first question that comes to mind is, "How do we measure memory?" This brings us to the term construct.
What is a construct?
A construct is a concept that is difficult to measure because it can be defined and measured in many different ways. For example, 'area' is a concept. We know it represents a space, but it can be measured in multiple units, like square feet, square meters, etc. Likewise, intelligence, happiness, sadness, and memory are concepts that do not have default units of measurement and are called constructs.
In our example, memory is a construct. To establish the claim that the ZingM pill improves memory, the researcher needs a way of measuring people's memory before and after taking the pill. This raises another question: how long should a person take the pill before they can see an effect? Although the answer might be a study in itself, for our current purposes, let's assume the pill takes effect if taken daily for at least 10 days.
But how do we measure memory? While there are many types of memory and various ways of measuring them, we will keep things simple by assuming this pill improves recall memory.
To measure recall memory, the researcher devises a test in which they show a set of hard-to-remember medical terms and their meanings to a group of participants for 10 minutes. After a 10-minute break, participants are given a quiz where they must write down the meaning of each term shown.
Here is one such list that was handed over to the participants:
- Crepitus - grating, crackling or popping sounds of joints
- Gustatory Rhinitis - runny nose when you eat spicy food
- Horripilation - Goose bumps caused due to cold, fear, or excitement.
- Obdormition - numbness in a limb, often caused by constant pressure on nerves or lack of movement.
- Sphenopalatine ganglioneuralgia - brief headache caused by eating ice cream.
- Fasciculation - Muscle twitch
- Diaphragmatic flutter - hiccups
- Sternutate - Sneeze
- Vasovagal syncope - Fainting on seeing blood or shocking news.
The 'recall rate,' which is the number of words for which the participant wrote the correct meaning, is scored. Then, the participants are prescribed the new ZingM pill for 10 days. The researcher repeats the test after 10 days and measures the improvement in their recall by administering the same quiz.
In the above example, the construct was operationally defined so that it could be measured.
What is an Operational Definition?
The operational definition of a construct is the specific unit of measurement you use for it. Once you operationally define something, it is no longer a construct. If we define area in square feet, it becomes operationally defined. For example, 'minutes' is already operationally defined; there is no ambiguity in what is being measured.
However, creating an operational definition for a construct is not always straightforward. In such cases, you can measure expressed or implied actions or behaviors related to the construct. Here are a few examples:
- Hunger: A person's hunger can be measured by the number of calories they consume before feeling full.
- Fast Food Sales: It's difficult to find the total number of customers at a specific fast-food restaurant, as this data is private. However, the total number of ratings a restaurant has received (extracted from websites like Yelp) can serve as an operational definition for its popularity or sales. This technique can be applied to any product, book, or movie by collecting ratings data from websites like Amazon or Netflix. Some of these companies also provide a RESTful API to help you search their website and get results.
Which of the following are Constructs?
- Intelligence
- Effort
- Gallons of milk
- Hunger
- Annual salary in $
If you identified Intelligence, Effort, and Hunger, you got it right! How would you operationally define these? One possible way would be:
- Effort: e.g., Amount of time spent on a task
- Intelligence: e.g., IQ Test score
- Hunger: e.g., Grams or calories of food eaten
Phase 1: The 10-Day Study
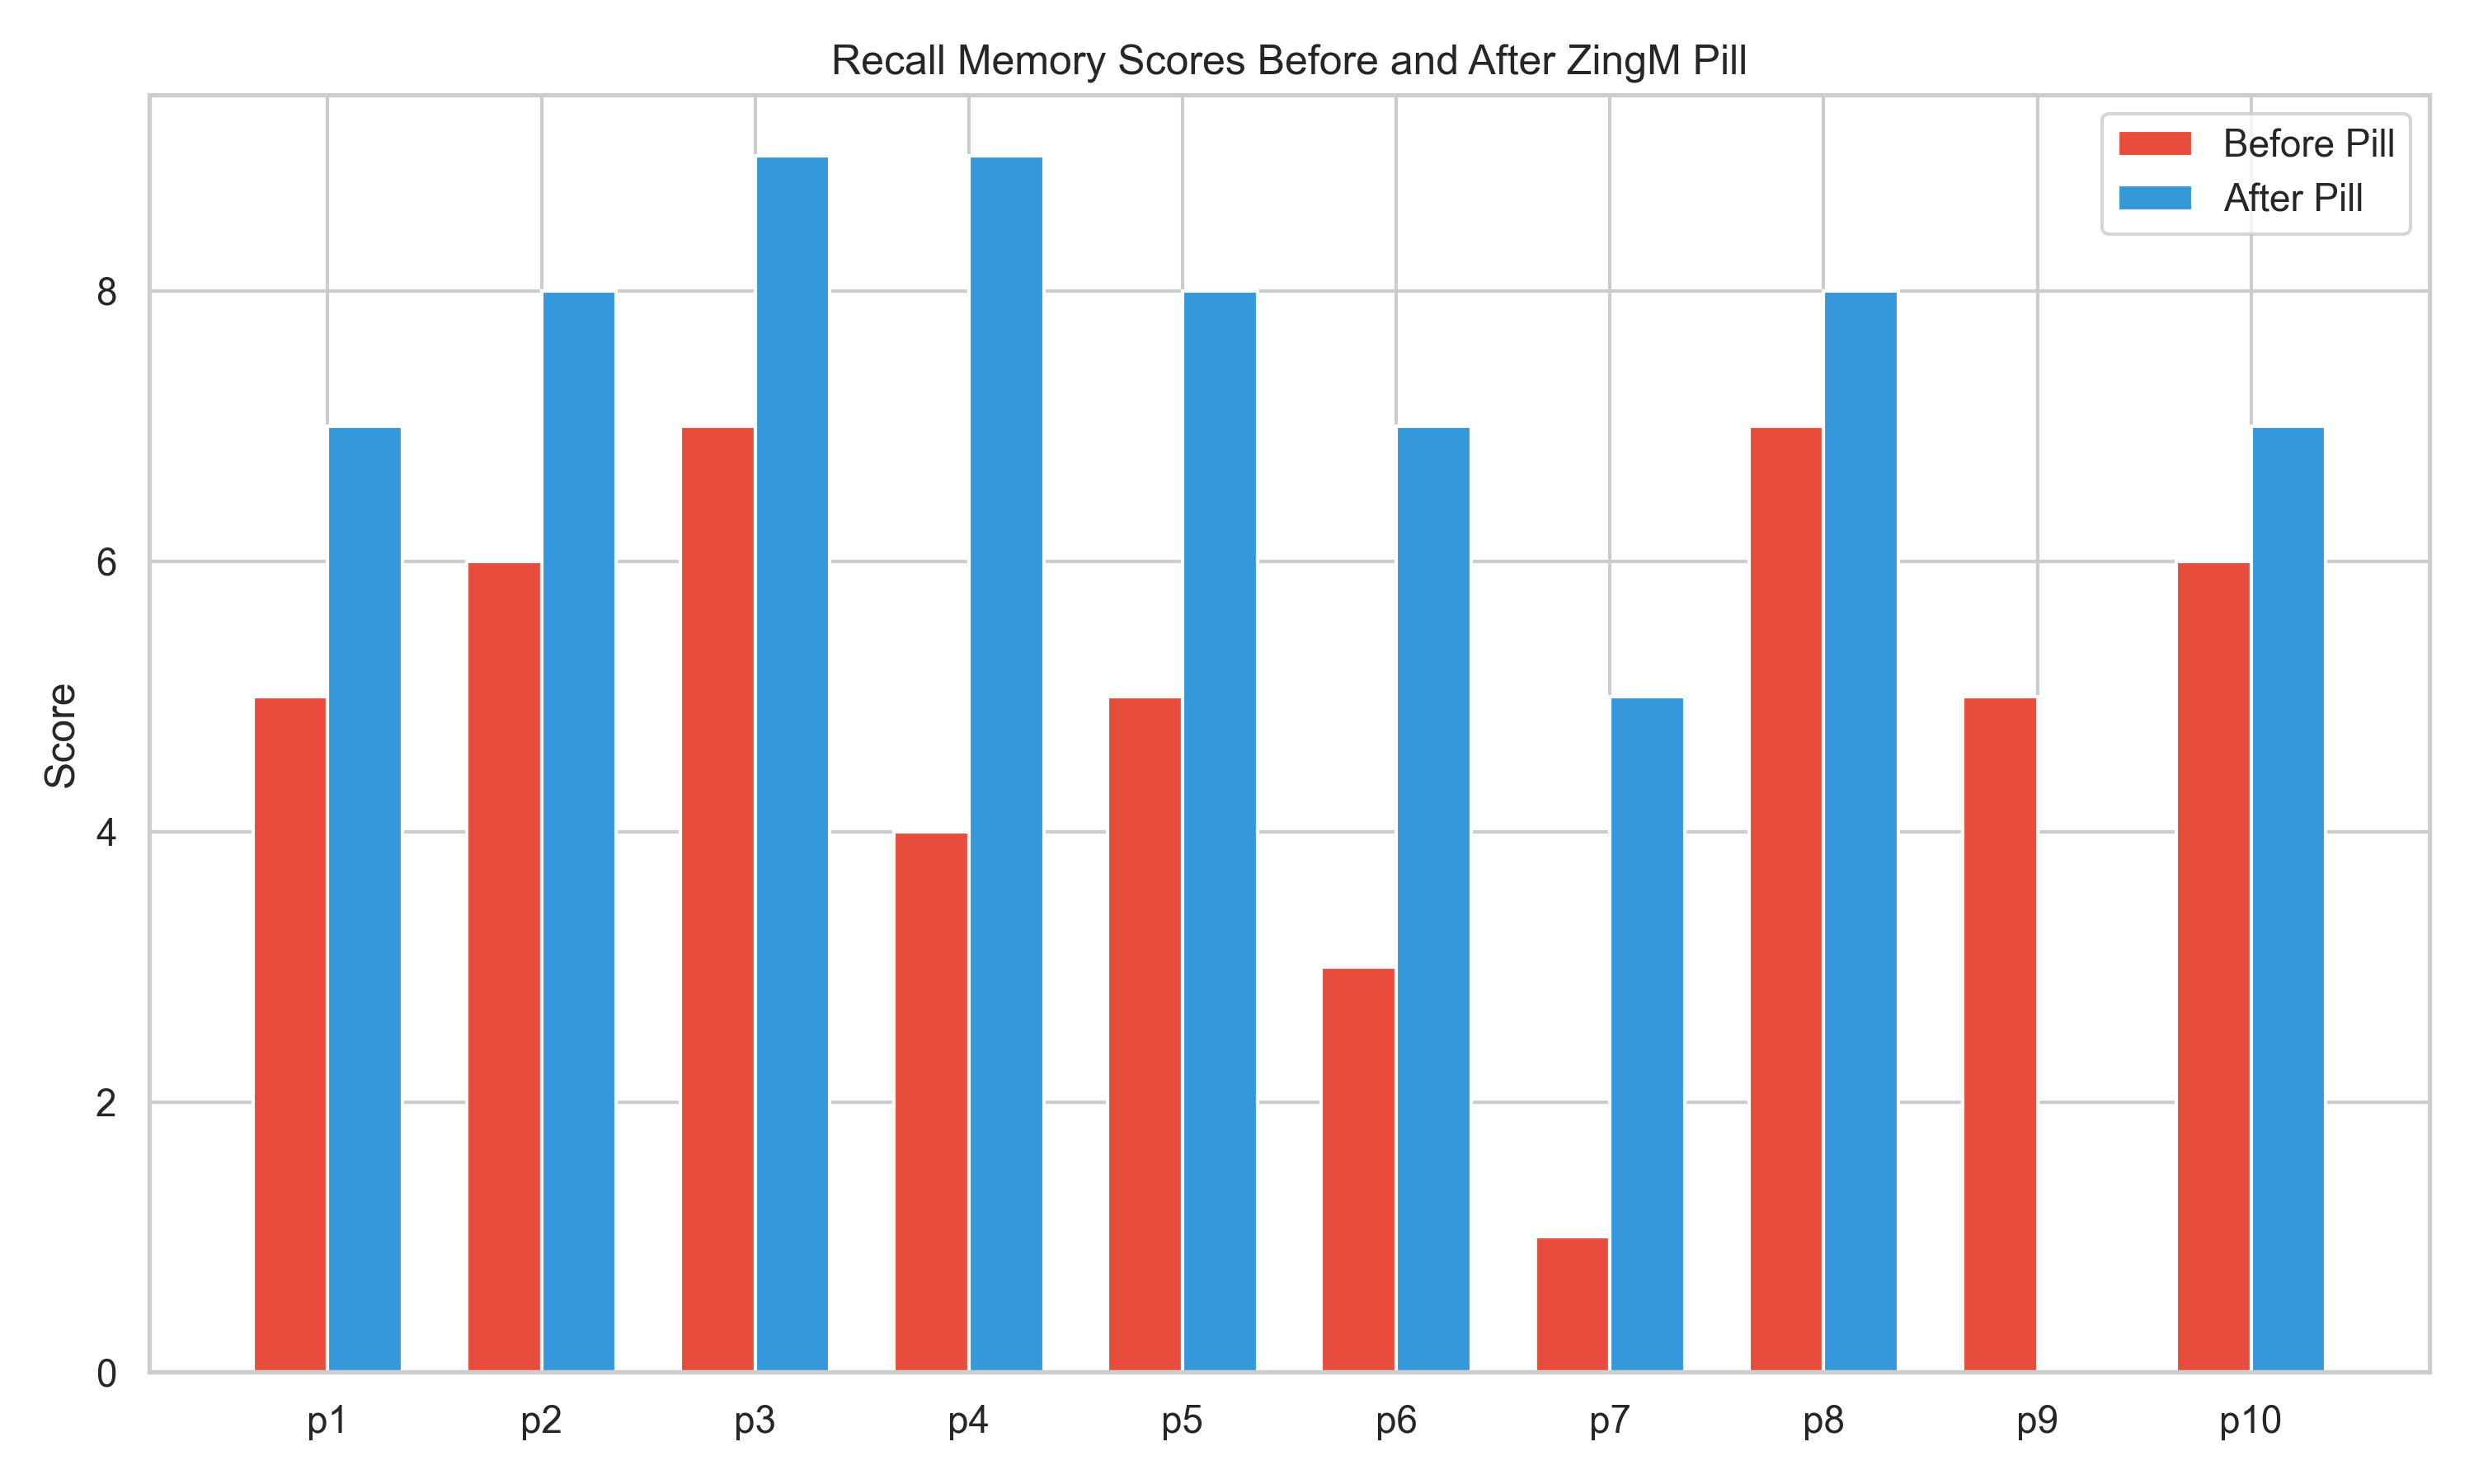
The researcher conducts the memory test for 10 participants, tabulates the scores, and plots a diagram as shown below:
ar2=np.array([np.arange(1,11),afterPill])
plt.ylabel("Score") plt.xlabel("Participant Id's") plt.xticks( x, xi) plt.title('Recall memory before and after taking ZingM pill') p1 = plt.bar(x, ar1.T[:,1], 0.35, color='r') p2 = plt.bar(x+0.35,ar2.T[:,1], 0.35) plt.legend((p1,p2),('Before', 'After'),loc='upper right', bbox_to_anchor=(1.2, 0.5), ncol=1, fontsize=8)
plt.show()
In the diagram, the participant IDs are on the x-axis, and the scores are on the y-axis.
From the diagram, you can see that the score improved for all participants except one, who had a drop in score from 5 to 0 after taking the pill. If we ignore this one anomaly (also known as an outlier), taking the ZingM pill appears to have a positive covariance with memory.
Should Outliers be Ignored?
The answer is, "it depends." It's always good practice to understand an outlier before discarding it. Sometimes, the goal is to find outliers in the data. Here are some examples where finding outliers is the primary objective:
- Fraud detection: Normal credit card transactions follow a pattern. A fraudulent transaction from a stolen card will deviate from this pattern (e.g., different location, amount, or type of purchase), and your task is to find these deviations.
- Fault detection: Heat and fire sensors trigger an alarm when there is an anomaly in their readings.
- Intrusion detection: Detects malicious activities on a computer or network based on differences from the regular pattern of behavior.
In our hypothetical example, the researcher found that the participant with a score of 0 had dropped out of the program and did not take the post-treatment test. Therefore, in this case, it is appropriate to drop that record.
Establishing Correlation
Phase 2: The 90-Day Study
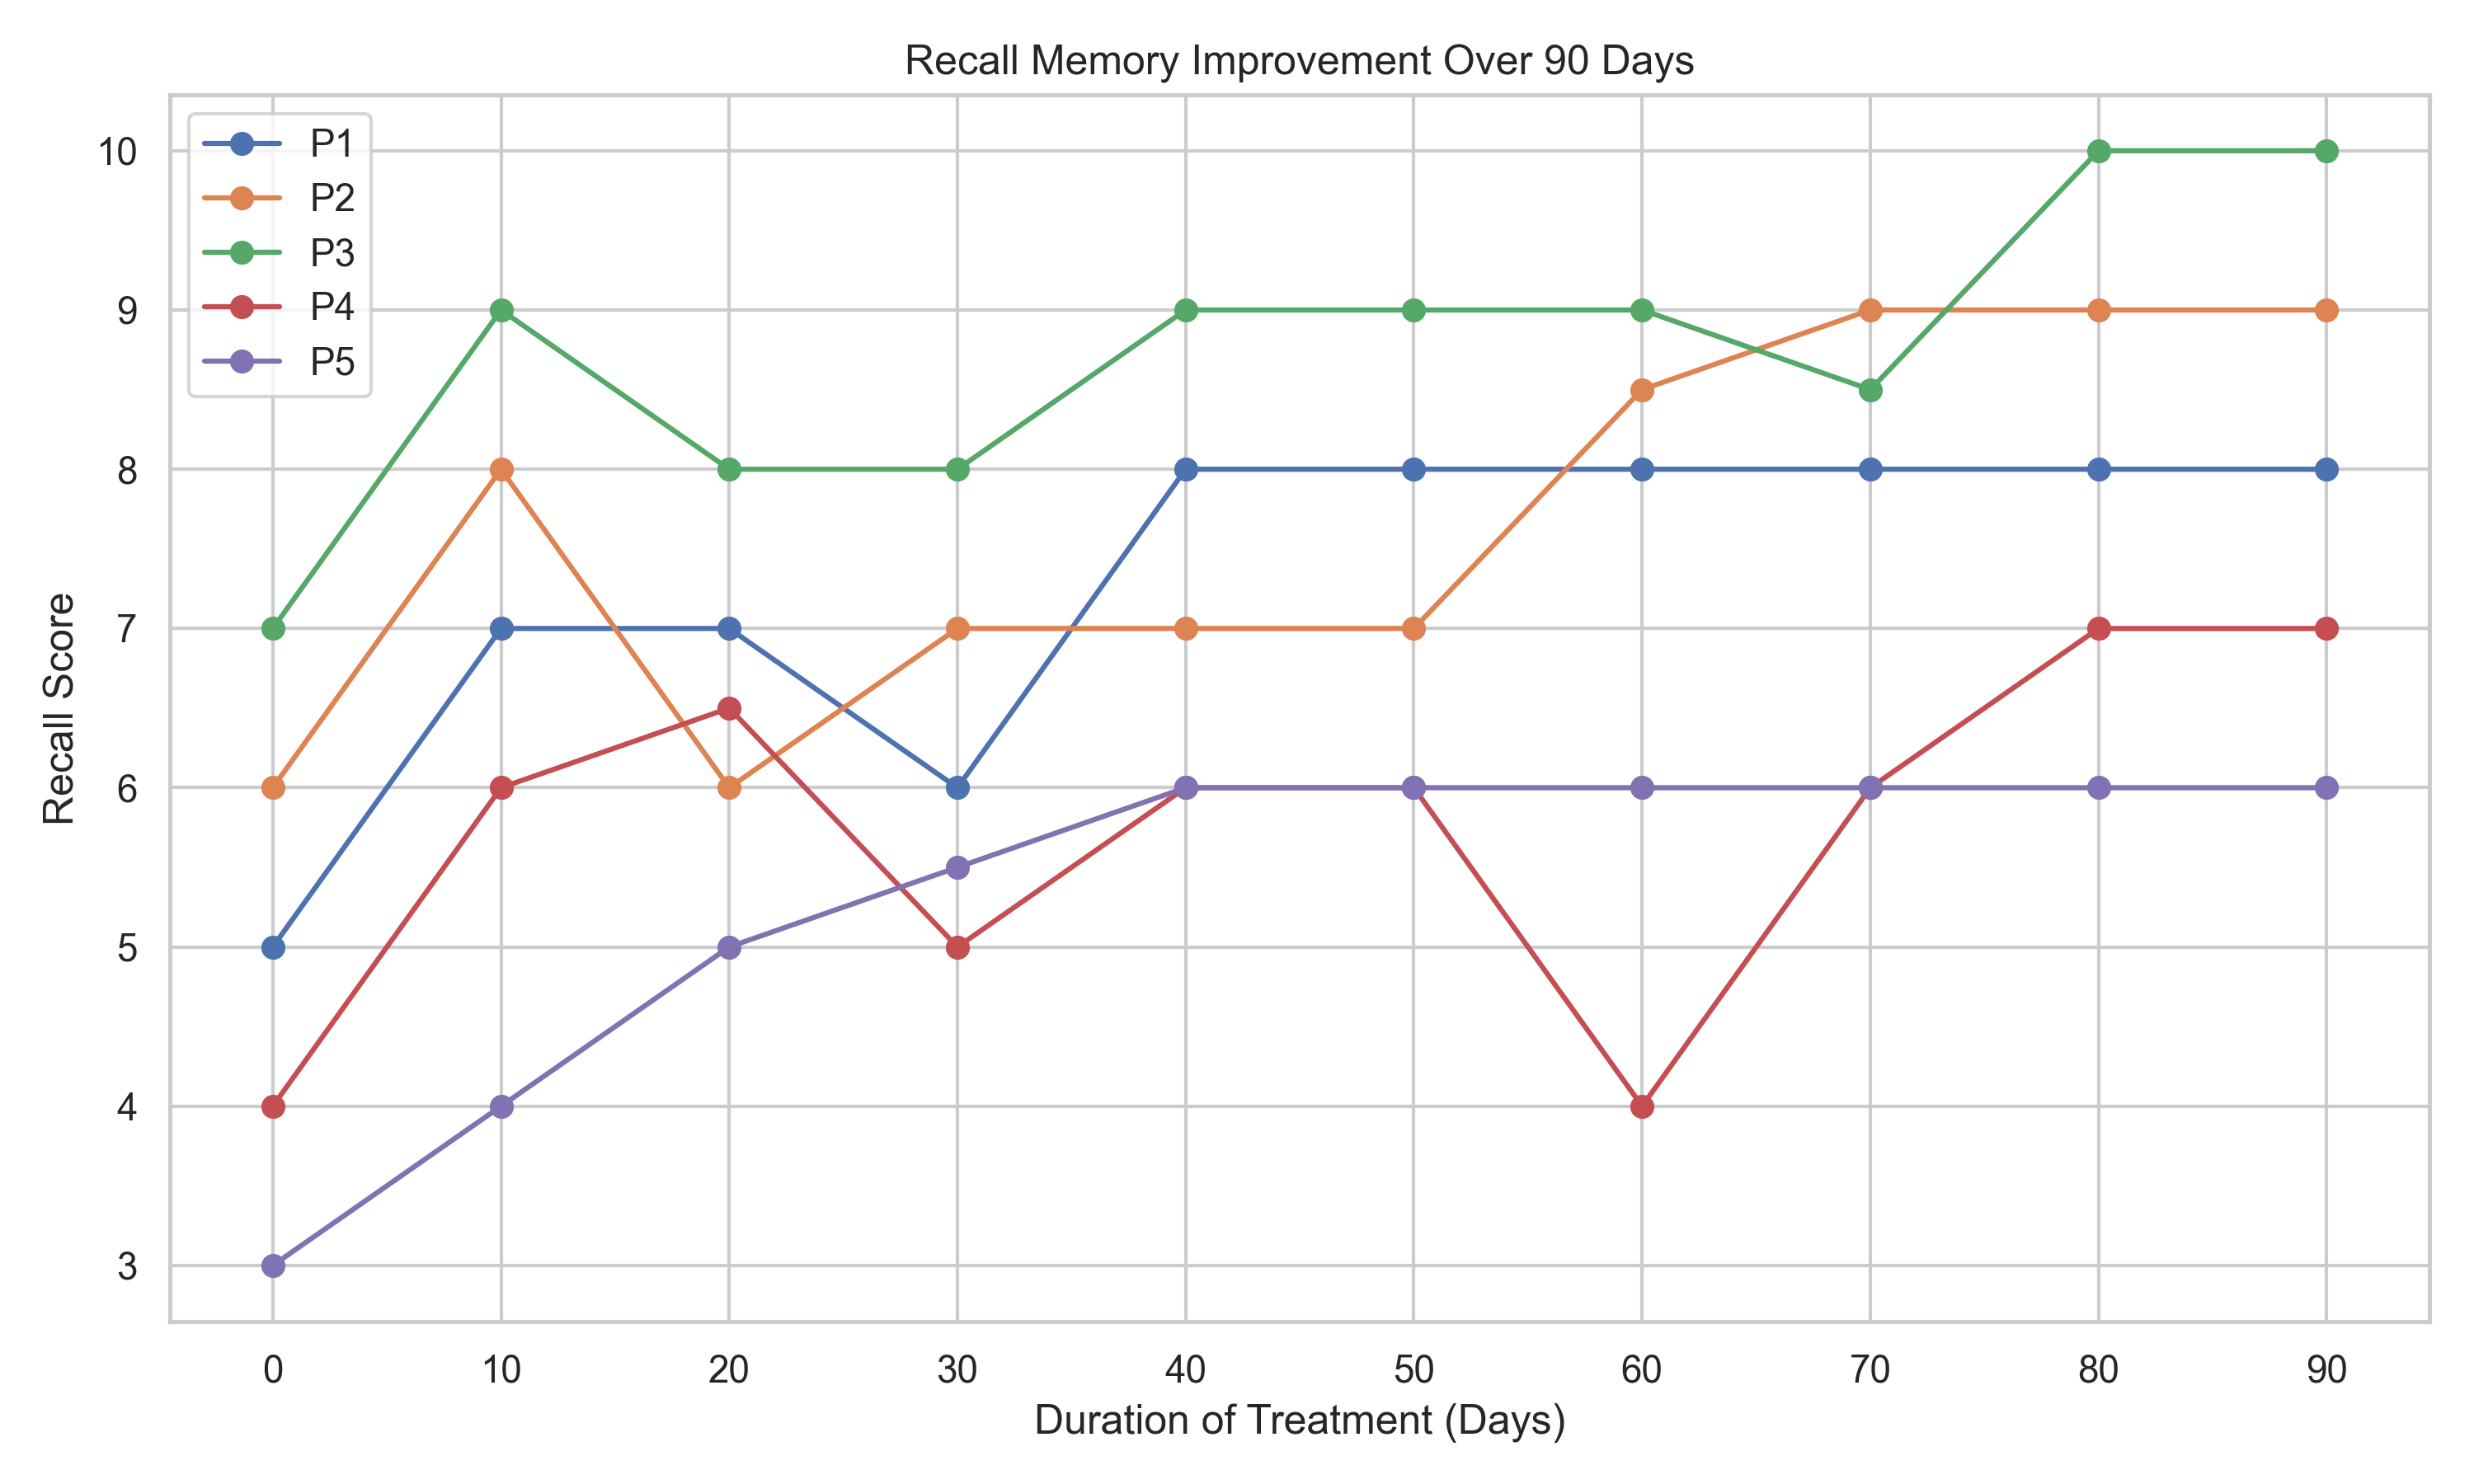
ZingM also claims that if a participant takes the pill daily, they will see a gradual improvement in memory, reaching their full potential within three months. The researcher continues the experiment, plotting the results every 10 days for three months. Here is the final plot for the five participants who completed the 90-day study; four others dropped out.
xi =['0', '10','20','30','40','50','60','70','80','90'] x = np.arange(1,11) p1 = [5,7,7,6,8,8,8,8,8,8] p2 = [6,8,6,7,7,7,8.5,9,9,9] p3 = [7,9,8,8,9,9,9,8.5,10,10] p4 = [4,6,6.5,5,6,6,4,6,7,7] p5 = [3,4,5,5.5,6,6,6,6,6,6]
x = np.arange(1,11) ar1=np.array([x,p1]) ar2=np.array([x,p2]) ar3=np.array([x,p3]) ar4=np.array([x,p4]) ar5=np.array([x,p5])
plt.ylabel("Score") plt.xlabel("Duration of Treatment in days") plt.title('Recall memory improvment over time with ZingM pill') p1, = plt.plot(ar1.T[:,0], ar1.T[:,1], label='p1') plt.legend()
p2, = plt.plot(ar2.T[:,0], ar2.T[:,1], label='p2') plt.legend()
p3 = plt.plot(ar3.T[:,0], ar3.T[:,1], label='p3') plt.legend() p4 = plt.plot(ar4.T[:,0], ar4.T[:,1], label='p4') plt.legend() p5 = plt.plot(ar5.T[:,0], ar5.T[:,1], label='p5')
plt.legend(loc='upper right', bbox_to_anchor=(1.2, 0.5)) plt.xticks( x, xi)
plt.show()
Notice that the treatment duration, the independent variable, is on the x-axis, and the test score, the dependent variable, is on the y-axis.
When we operationalize a construct, we create variables. Any characteristic that can vary is a variable, but it must have at least two possible values. Variables hold data, and data comes in various forms. In the subsequent chapter Types of Data, you will learn more about variables and data types.
Drawing Conclusions
Based on the plot, the researcher concludes there is a strong positive covariance between the treatment duration and memory scores. He concludes that this positive correlation proves the hypothesis that the ZingM pill causes memory improvement.
Is the conclusion correct?
Not really, and here are the reasons why:
- There is no mention of the age of the participants.
- There is no mention of how these participants were selected. For example, a group of medical students would have a strong advantage on the test, as they might already be familiar with the terminology.
- A sample size of just five participants is not large enough to conclude a causal effect.
- There is no mention of a control group.
- There is no mention of whether the same set of medical terms was used for all tests.
Any of the factors above, and others not considered by the researcher, can skew the results. They might show a strong relationship between variables where none exists (or vice-versa), potentially causing a Simpson's Paradox. These factors are called confounding factors or lurking variables.
For the results to be valid, the researcher must consider the above factors and also ensure the following:
- Obtain a random set of participants for the treatment group.
- Create a randomized control group.
- Any other control variable, like the participants' diet, work, or stress levels, should be kept constant during the study period.
While lurking variables or confounding factors are unknown to the researcher, control variables are known and should be kept constant so their influence does not interfere with the relationship between the independent and dependent variables.
- An operational definition may not perfectly measure a construct.
- Confounding factors are variables the researcher did not consider, which can unknowingly distort the results.
- Proving a hypothesis often requires applying sophisticated models from Inferential Statistics.
- Finding a strong correlation between variables does not necessarily mean causation. It is much easier to find correlation than it is to prove causation.