Data Point (a.k.a. Example or Observation)
Data Set
Outliers
- Bad data: The data may have been entered incorrectly or resulted from a faulty measurement. If an investigation confirms this, the outlier should be corrected or deleted.
- A true, rare event: The outlier may be a valid data point that is simply unusual. In this case, it should not be deleted, but it requires careful consideration during analysis.
Construct
Operational Definition
The specific way a construct is measured. Once a construct is operationally defined, it is no longer ambiguous (e.g., defining "intelligence" as an "IQ score").
Treatment
Observational Study
Treatment Group
Control Group
Independent Variable (a.k.a. Feature, Predictor)
Dependent Variable (a.k.a. Outcome, Target)
Confounding Variable (a.k.a. Lurking Variable)
Control Variable
Normalization (or Min-Max Scaling)
A technique used to transform numerical data to a common scale, typically between 0 and 1. The formula is:
x_new = (x - x_min) / (x_max - x_min)
Normalization is sensitive to outliers and is usually applied after they have been removed.
Standardization (or Z-Score Normalization)
A technique used to transform numerical data to have a mean of 0 and a standard deviation of 1. The formula is:
x_new = (x - mean) / std_dev
The resulting value, x_new, is called the z-score. Standardization is not affected by outliers and does not have a bounded range like normalization.
Central Limit Theorem
The Central Limit Theorem states that if you take a sufficiently large number of random samples from a population and calculate the mean of each sample, the distribution of those sample means will be approximately normal, regardless of the shape of the original population's distribution. The mean of the sample means will also be a good estimate of the population mean.
Standard Error
The standard deviation of the sampling distribution of a statistic (most commonly, the mean). A small standard error indicates that the sample statistic is a more accurate estimate of the population parameter.
Variance
Coefficient of Variation (CV)
The ratio of the standard deviation to the mean (std_dev / mean). It is a useful statistic for comparing the degree of variation between two different datasets, even if their means are drastically different.
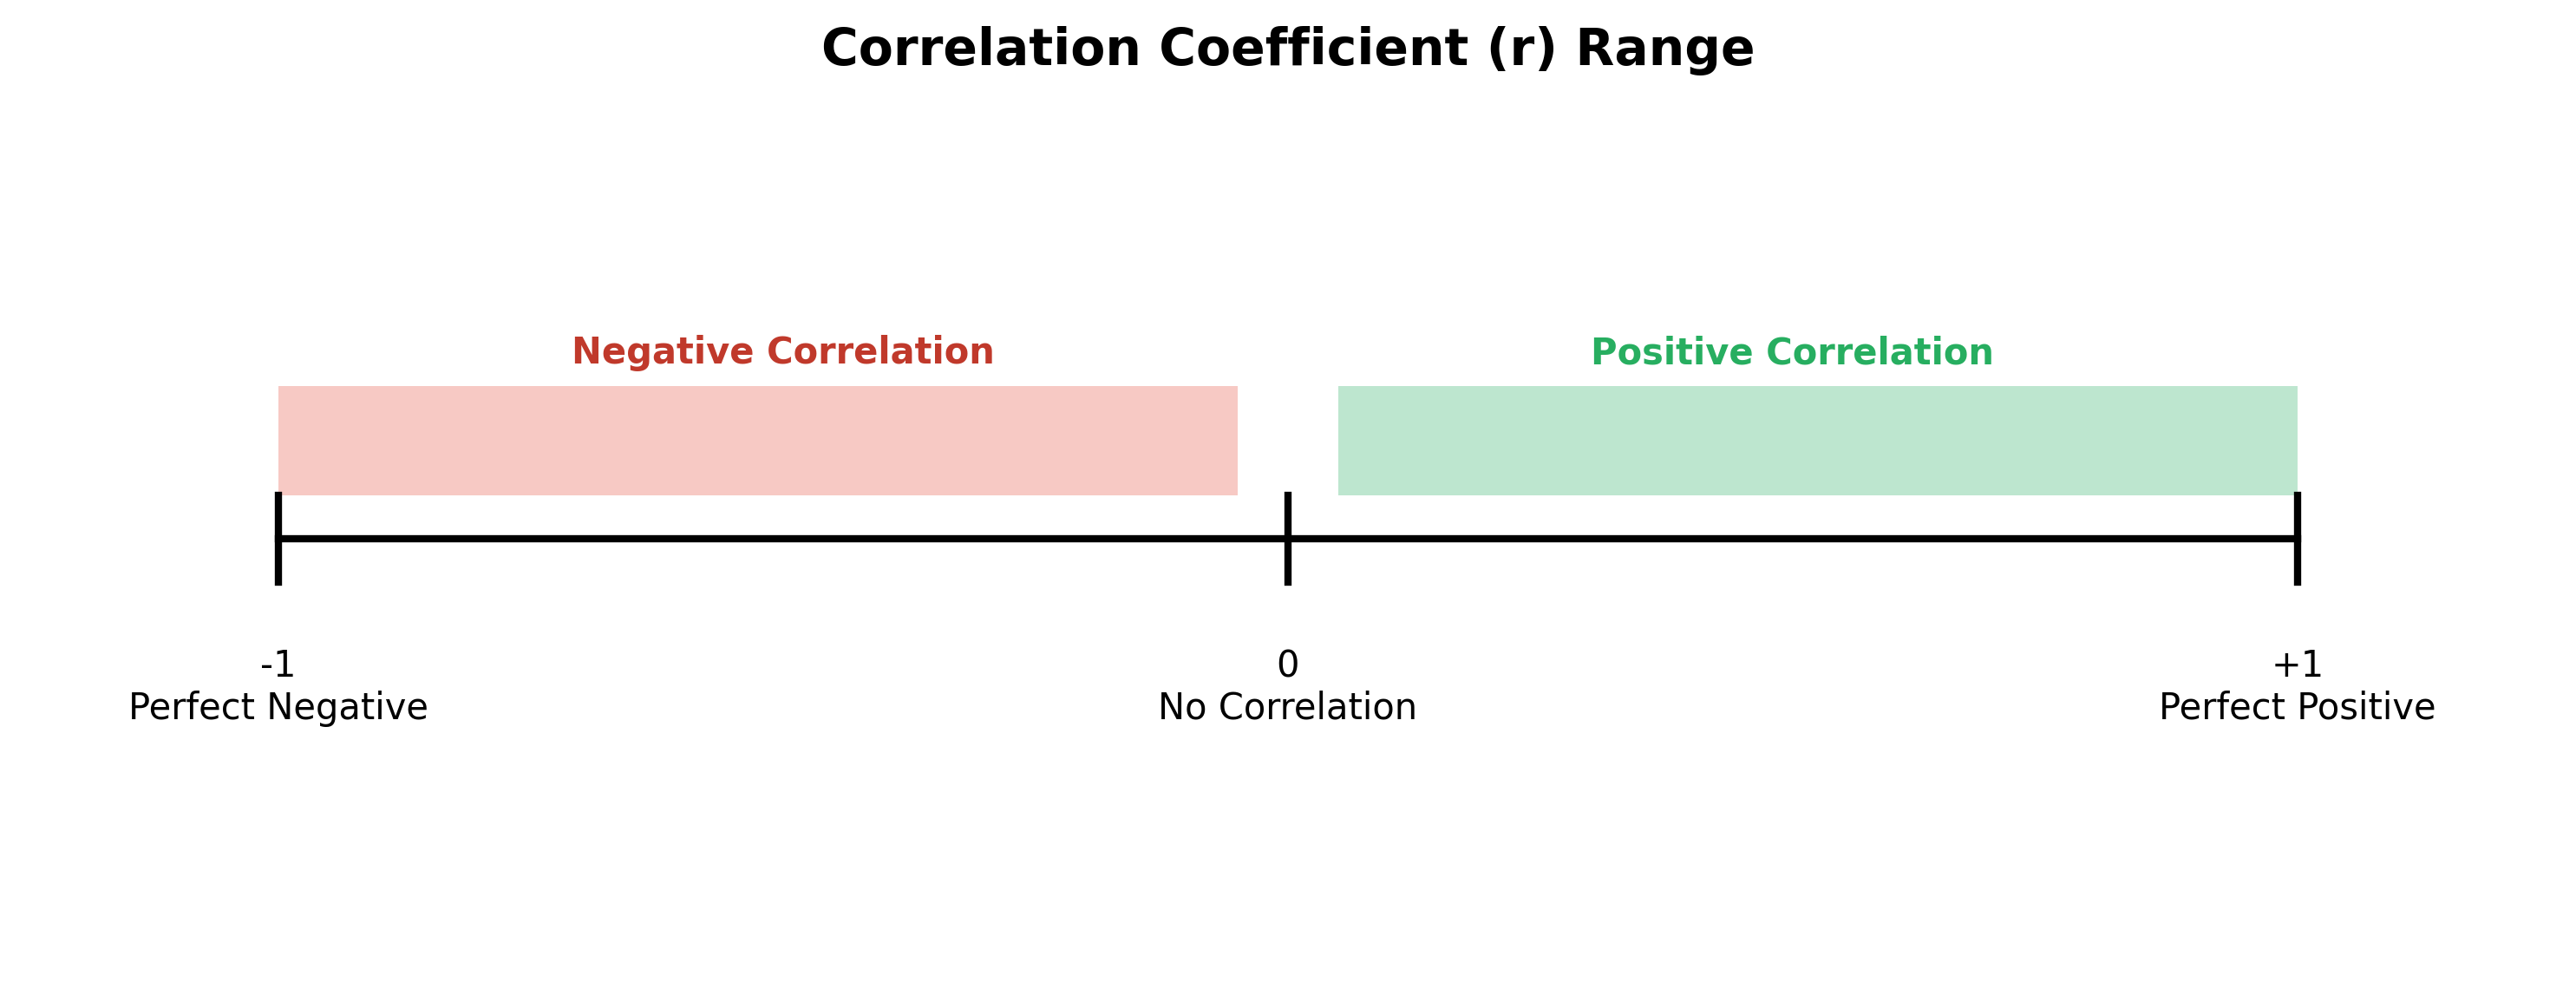
Covariance and Correlation
Correlation is a scaled version of covariance that ranges from -1 to +1, making it easier to interpret. A value of +1 indicates a perfect positive correlation, -1 indicates a perfect negative correlation, and 0 indicates no correlation.
Confidence Level
The percentage of times you expect to reproduce an estimate of the population parameter within a certain range (the confidence interval). For example, a 95% confidence level means that if you were to repeat the experiment many times, 95% of the calculated confidence intervals would contain the true population parameter.
Confidence Interval
The width of the confidence interval is affected by:
- Sample size: Larger samples produce narrower intervals.
- Variability: Greater variability in the sample produces wider intervals.
Discrete Variable
Continuous Variable
Frequency Distribution
A summary of the number of times each distinct value of a variable occurs. It is usually applied to categorical variables.
Null Hypothesis (H₀)
The null hypothesis represents the status quo or the existing belief, typically stating that there is no effect, no difference, or no relationship. The goal of hypothesis testing is to determine whether there is enough evidence to reject the null hypothesis in favor of an alternative hypothesis.
p-value
The probability of obtaining a result as extreme or more extreme than the one observed in the data, assuming the null hypothesis is true. A small p-value (typically ≤ 0.05) indicates that the observed result is unlikely to have occurred by chance alone, providing evidence against the null hypothesis.
t-test vs. ANOVA
- t-test: Used to compare the means of two groups.
- ANOVA (Analysis of Variance): Used to compare the means of three or more groups.
t-test vs. Chi-Squared Test
- t-test: Used for continuous data to compare the means of two groups.
- Chi-Squared Test: Used for categorical data to test for a relationship between two variables or to see if the observed data fits an expected distribution.