Data Cleaning
Garbage In, Garbage Out.
A sound analysis is built on a foundation of good data. However, in most real-world scenarios, starting with clean data is a luxury. A significant portion of a data analyst's time is spent cleaning and preparing the data, because an analysis based on bad data will also be bad.
Typical issues include:
- Missing fields: This is one of the most common problems in a dataset.
- Inconsistent formatting: For example, a date column might contain multiple formats, such as
mm/dd/yyyyandyyyy-mm-dd. - Nonsensical data: A person's age might be listed as -10, or a "state" column might contain a value that isn't a valid state.
What is Data Wrangling?
Data wrangling is the process of cleaning, structuring, and enriching raw data into a desired format for better decision-making in less time. The end goal is to provide clean, usable data to data scientists so they can focus on analysis. In many complex cases, data wrangling is an iterative process, as not all issues will be apparent at first glance.
Common Causes of Erroneous Data
- Human error: Typos, missed entries, or data entered in the wrong fields.
- Programming errors: For example, Optical Character Recognition (OCR) might incorrectly identify characters.
- Integration issues: Data from different databases with different schemas may be merged without proper column matching.
- Evolving applications: A business might add new data fields to an application over time. Older records will have empty values for these new fields.
- Conversion errors: Errors can occur when converting data from one format to another.
- Data corruption: Data can be corrupted during transmission from one storage system to another.
- Legacy systems: In some older systems, numerical values like 99.99 were used to signify null or empty values.
Steps for Data Cleaning
- Define valid value sets: For each field, determine what constitutes a valid value. Ask relevant questions, such as, "Should the start date always come before the end date?" or "Can the age column contain negative values?"
- Audit the data: Programmatically scan the data to identify outliers and oddities. Investigate these to determine if they are errors or genuinely interesting data points. For example, is an age of 130 a typo or a valid outlier?
- Ensure consistency: Standardize data formats. For example, if you have both "US" and "USA" for country codes, choose one format and apply it consistently.
- Remove duplicates: Identify and remove duplicate rows.
- Address inconsistencies: If a user has multiple location entries (e.g., a manually entered address, a GPS location, and a network provider location), determine which is the most accurate.
- Rename columns: If the original column names are unclear or unwieldy, rename them to be more descriptive. This will save you a lot of pain when writing queries.
- Develop a cleaning plan: Once all flaws are detected, create a plan and write code to clean the data.
- Iterate: Data cleaning is often an iterative process involving a mix of automated scripts and manual intervention. Continue to correct and verify the data until you are confident in its quality.
Domain knowledge is also essential to truly understand your data and the problems you might encounter.
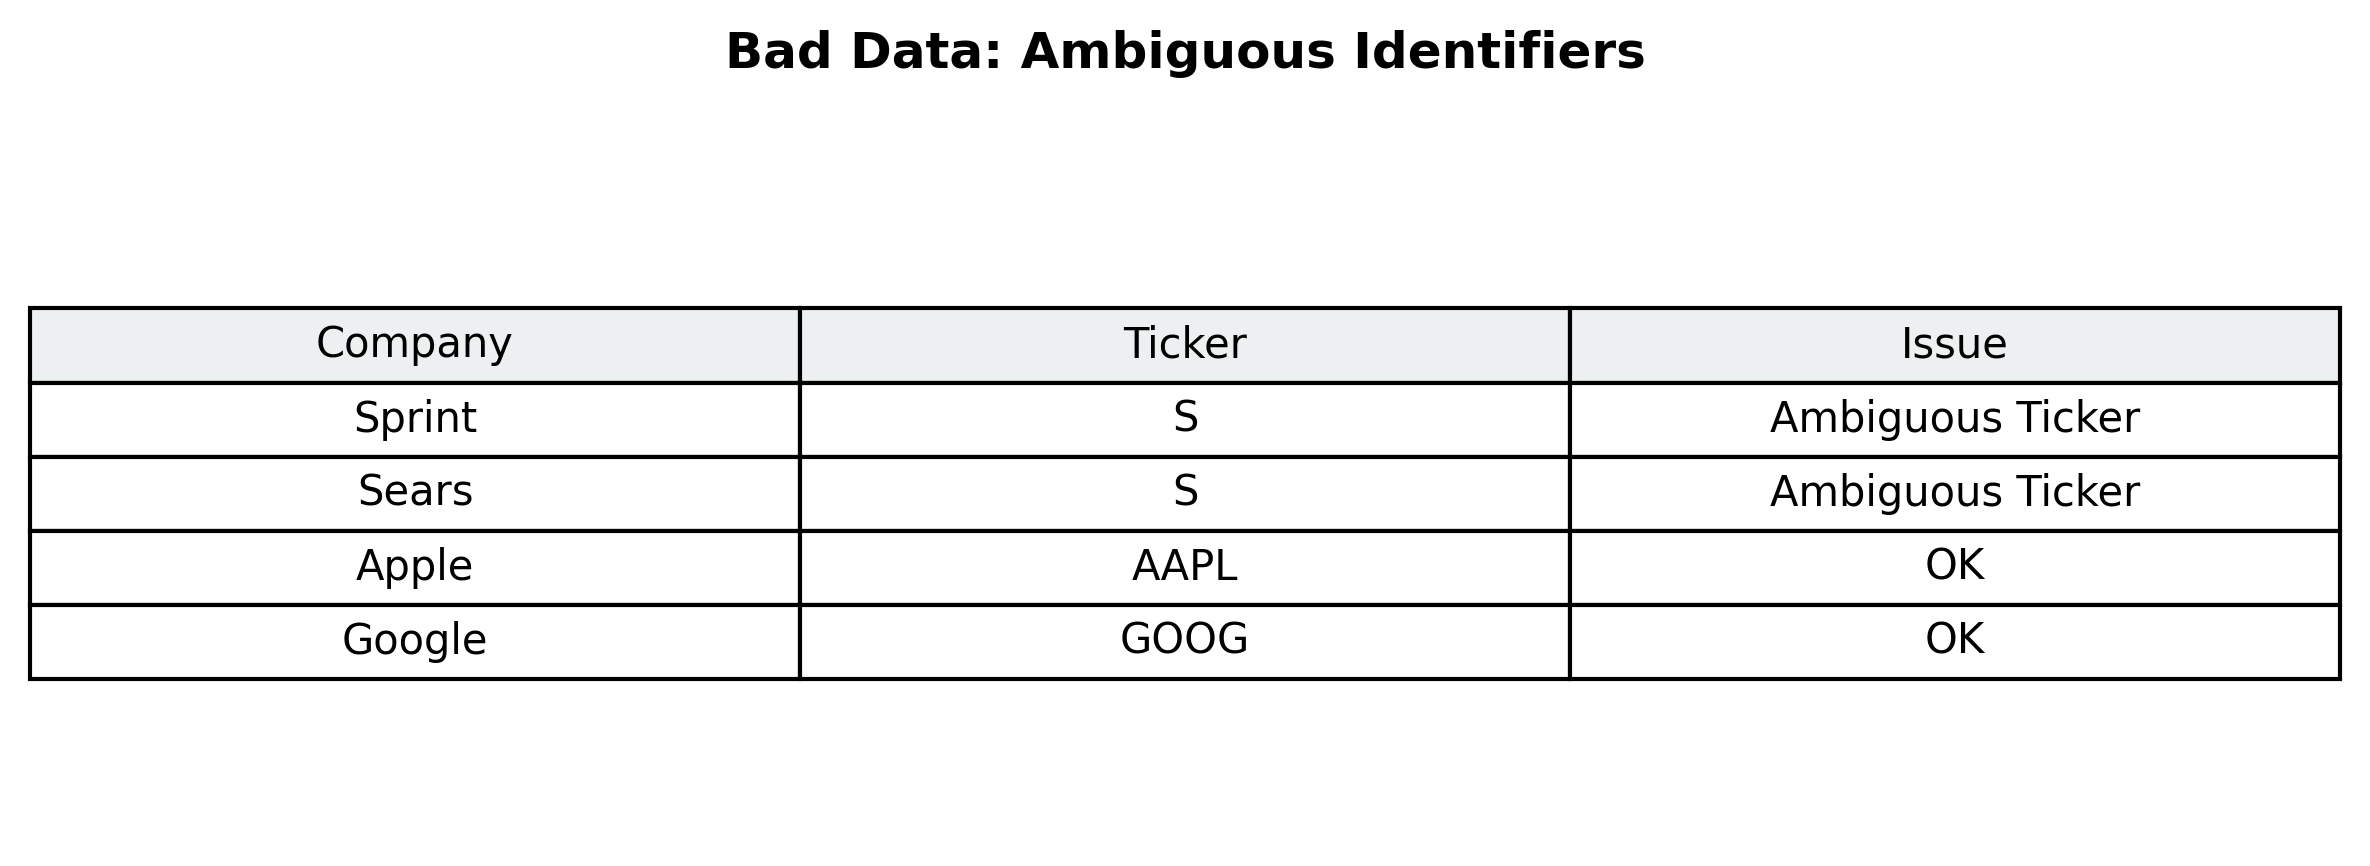
Case Study of Bad Data
The following image, from the Bad Data Handbook, illustrates a real-world data quality issue:
Handling Missing Values
When you have missing values, you have a few options. First, it's important to understand why the values are missing.
- Missing Completely At Random (MCAR): The missingness is unrelated to any other variable. In this case, you can often safely drop the records with missing values, as long as you have enough data remaining for your analysis. A common rule of thumb is that you can remove up to 5% of observations due to missing values without introducing significant bias.
- Missing at Random (MAR): The missingness is related to another observed variable. For example, if managers are more likely to skip reporting their salary than union workers, the "salary" variable is MAR. In this case, you can also drop the records, as the missingness is not related to the salary itself, but to the "job title" variable.
- Missing Not at Random (MNAR): The missingness is related to the value of the missing variable itself. For example, people with the lowest education levels might be more likely to skip the "education" field in a survey. In these cases, the missing values cannot be ignored, and you should investigate and impute a correct value.
Classifying missing values requires a careful study of the data. Once you are confident in the pattern of missingness, you can choose an appropriate technique to handle it.
Techniques for Imputing Missing Values
Dropping missing values might not be an option if:
- The other fields in the record are valuable for your analysis.
- The libraries or models you are using cannot handle missing values.
Here are some common imputation methods:
- Mean/Median: Replace the missing value with the mean or median of the column. Use the mean if there are no extreme outliers; otherwise, the median is a better choice.
- Regression: Use a regression model to predict the missing value based on other variables.
- Stochastic Regression: This is similar to regression but adds a random error term to the prediction, which can provide a more realistic estimate.
- K-Nearest Neighbors (KNN): Impute the missing value with the value from the "nearest" or most similar records.
- Last Observation Carried Forward (LOCF): Sort the data and fill the missing value with the last observed value. This method can introduce bias and is not always recommended.
- Hot Deck: Replace the missing value with a randomly selected value from a similar record.
- Multiple Imputations: Create multiple complete datasets by imputing the missing values multiple times. This method accounts for the uncertainty of the imputation process.
While imputation can be useful, it does not perfectly substitute for real values and can introduce bias. It's not an ideal solution, but it may be sufficient in certain situations.
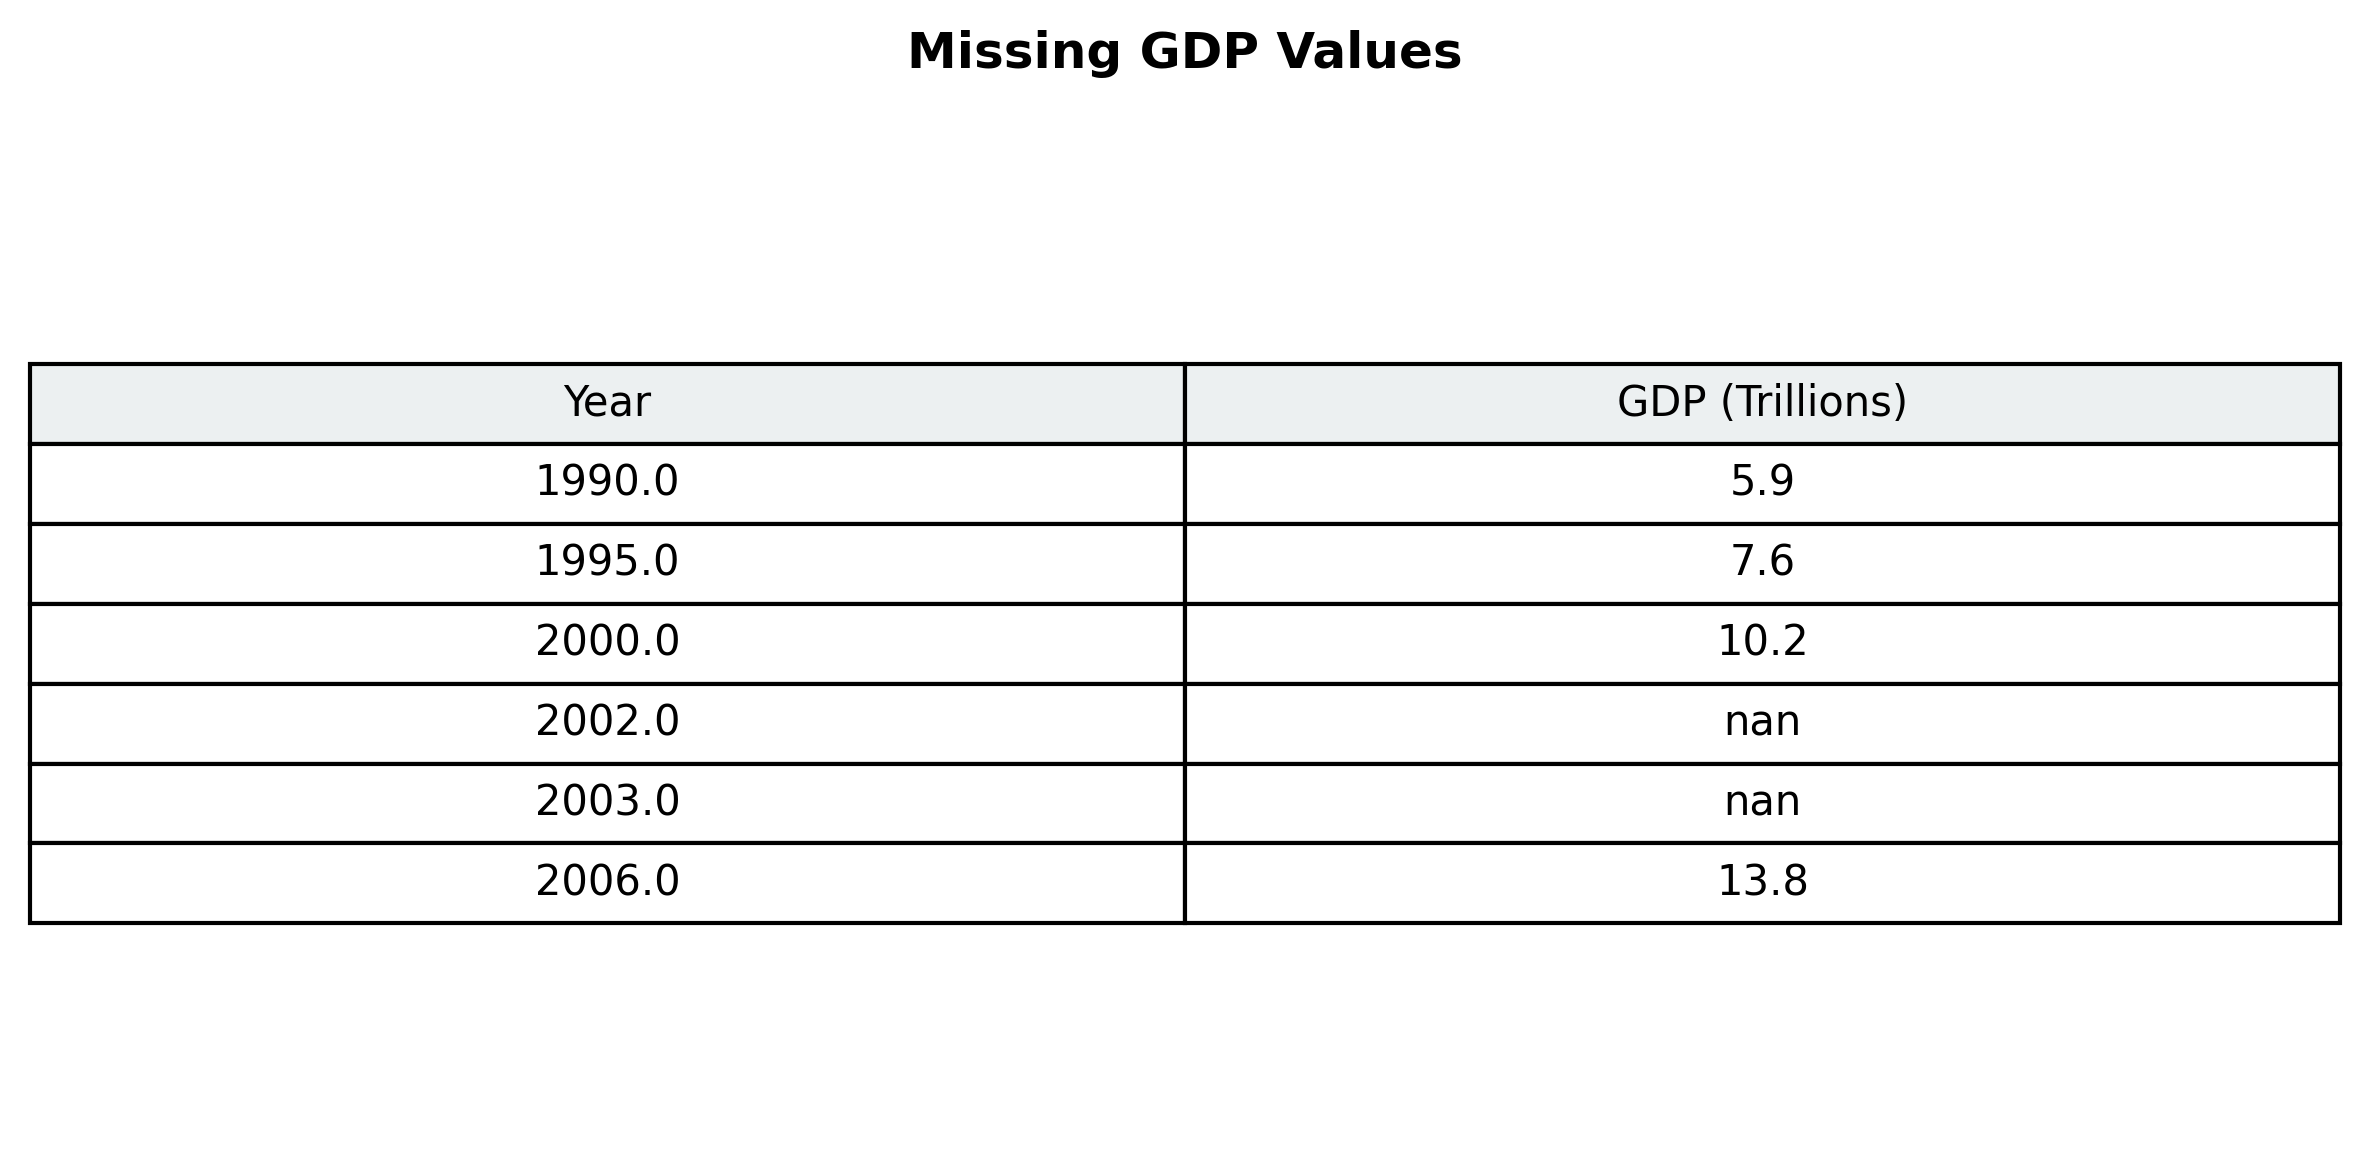
Quiz:
Here are the GDP values for the US from 1990 to 2006. The values for 2002 and 2003 are missing. Which technique would you use to impute these values?