Pivot Tables and More
You can create spreadsheet-style pivot tables to help aggregate and present column data in different ways. Refer to: https://pandas.pydata.org/pandas-docs/stable/reference/api/pandas.pivot_table.html
You can also refer to the melt function, which provides similar functionality: https://pandas.pydata.org/docs/reference/api/pandas.melt.html
Here is an example of using some of these functions. Create a simple DataFrame with rows and columns as shown below:
import pandas as pd

df = pd.DataFrame(
    {
        "county": ["Wayne", "Oakland", "Wasthenaw", "Kent"],
        "2020-09-01": [5, 11, 10, 5],
        "2020-09-02": [10, 5, 9, 15],
        "2020-09-03": [4, 8, 12, 16],
    }
)

df.head()
Output:
	county	2020-09-01	2020-09-02	2020-09-03
0	Wayne	    5	         10	        4
1	Oakland	    11	          5	        8
2	Wasthenaw	10	          9	        12
3	Kent	    5	          15	    16
Using melt: Now, using melt, you can convert the date columns into a single 'date' column, as shown below:
df2 = df.melt(
    id_vars=["county"],
    value_vars=["2020-09-01", "2020-09-02", "2020-09-03"],
    value_name="count",
    var_name="date",
)
df2.head()
Output:
	county	    date	    count
0	Wayne	    2020-09-01	5
1	Oakland	    2020-09-01	11
2	Wasthenaw	2020-09-01	10
3	Kent	    2020-09-01	5
4	Wayne	    2020-09-02	10
While the statement above has hardcoded column values for the value_vars variable, you can make it dynamic so that the columns are picked up based on their index positions in the df.columns index, as shown in the expression below:
df2 = df.melt(
    id_vars=["county"], value_vars=df.columns[1:4], value_name="count", var_name="date"
)
And now you can get the county values as column values by using pivot_table, as shown below:
df3 = df2.pivot_table(index=["date"], columns=["county"], values="count")
df3.head()
Output:
county	    Kent	    Oakland	    Wasthenaw   Wayne
date
2020-09-01	5	        11	        10	        5
2020-09-02	15	        5	        9	        10
2020-09-03	16	        8	        12	        4
Once we have the data in this format, we can now get a time series plot across all the dates in one statement, as shown below:
ax = df3.plot()
ax.legend(bbox_to_anchor=(1.1, 1.05))
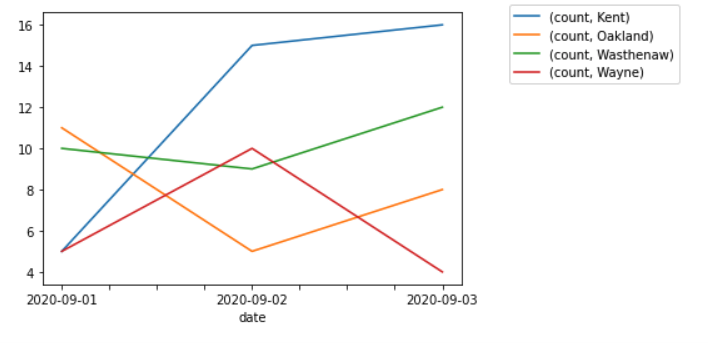
Notice the keyword arguments and the values that are used on the Matplotlib AxesSubplot object that is returned from the plot() function.
Example 2 using pivot_table
import pandas as pd
df = pd.read_csv(
"https://raw.githubusercontent.com/jravi123/datasets/refs/heads/main/datasets/pc_per_100.csv"
)
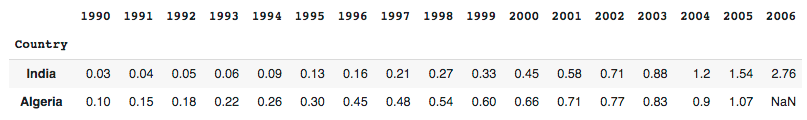
df.set_index("Country", inplace=True)
df2 = df.loc[["India", "Algeria"]]
df2
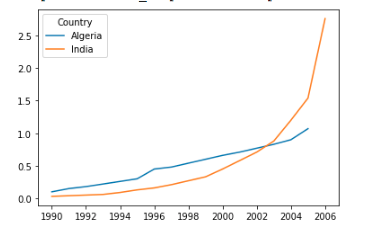
df2.pivot_table(columns=["Country"]).plot()
 ```
```